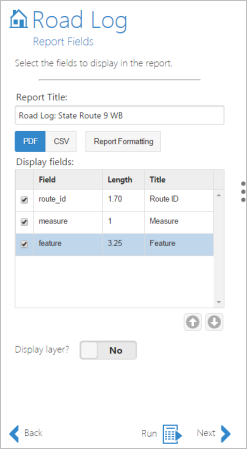
A road log report is a report that traverses a route or a set of routes and lists the events and intersections that occur in measure order along with the measure at which they occur.

Perform the steps in the following sections to create a road log report similar to the one shown above.
Required data
The following data layers are used to create the report. The layer names used here are examples; you can use your own layer names to create your reports.
| LRS data type | Layer name | Explanation |
|---|---|---|
Network Layer | MilePoint | The layer from which routes are selected. The log reports are created based on the chosen routes. |
Intersection Layer | Route_Intersections | The point layer containing the route with route intersections. |
Event Layer | Bridges | The point event containing the bridge locations. |
Event Layer | Road_Signs | The point event containing the road sign locations. |
Event Layer | Speed_Limit | The line event containing the speed limit data. |
Selecting the network
The first step to creating a road log report is to choose the route network.
- Go to your reporting URL.
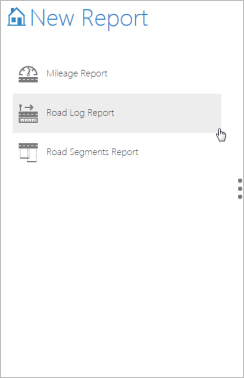
- Click the New Report button
 .
. - Click the Road Log Report button
 .
. 
Creating a new road log report - Click the Route Network drop-down arrow and choose a route network.
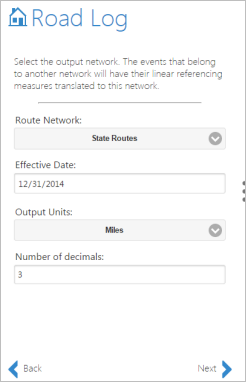
Choosing network properties - Choose the Effective Date for the report.
- Choose the Output Units using the drop-down arrow.
The road segments will be reported using these units.
- Type the Number of decimals.
These are the number of decimals that show in the segments measures in the report.
- Type the number of decimals you want to be displayed in the measures column of the report in the Number of decimals text box.
- Cliquez sur Suivant.
Selecting the routes
The next step is to select the routes for which the road log will be created. There are two options available: spatial selection and attribute selection.
The spatial and attribute filters work in conjunction with each other. This means you can apply an attribute filter in addition to the spatial filter and vice versa. You can also choose to apply either of the spatial or attribute filters.
Remarque :
If you want to select all the routes in your data to be used for reporting, do not apply any spatial or attribute filters.
Astuce:
Click Show SQL to write an SQL statement instead of using the selection method to create an attribute filter.
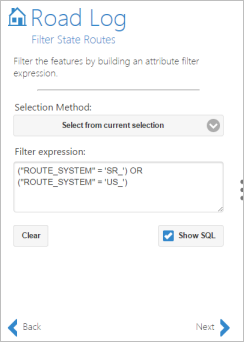
Spatial selection
You have several options for selecting the segments spatially: Drawing bounding graphics, Selecting polygon features, Select by proximity, Select by extent and Select by route.
Drawing bounding graphics
There are several tools available to draw the bounding graphics to select routes. They are described in the following table:
Tools to draw bounding graphics
 | Select By Point |
 | Select By Line |
 | Select By Polygon |
 | Select By Rectangle |
 | Select By Circle |
 | Clear Selection |
Remarque :
Before you draw the bounding graphic or use any other spatial filtering tool, you have the option to apply the filter in three ways: Intersects, Completely Within, and Touches Edge.
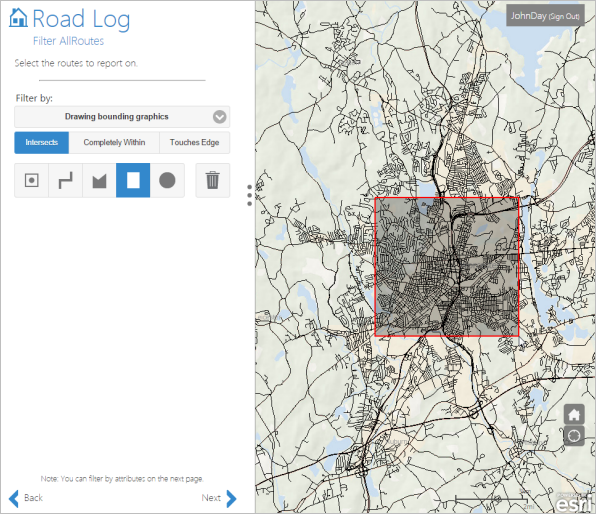
- Intersects—The routes that intersect the graphic are selected.
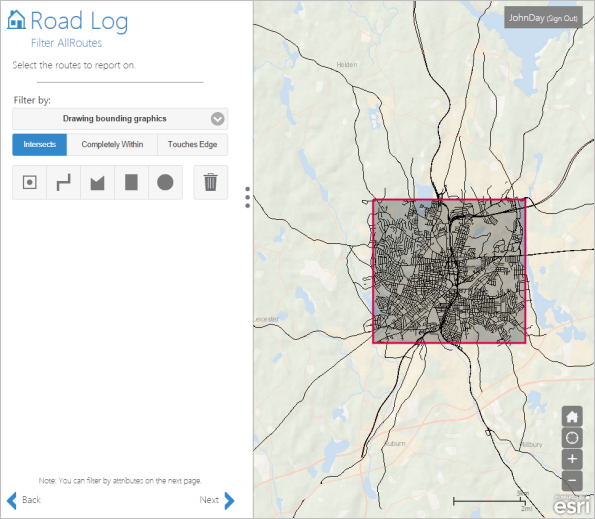
Select routes that intersect a bounding graphic. - Completely Within—Routes that are completely within the graphic are selected.
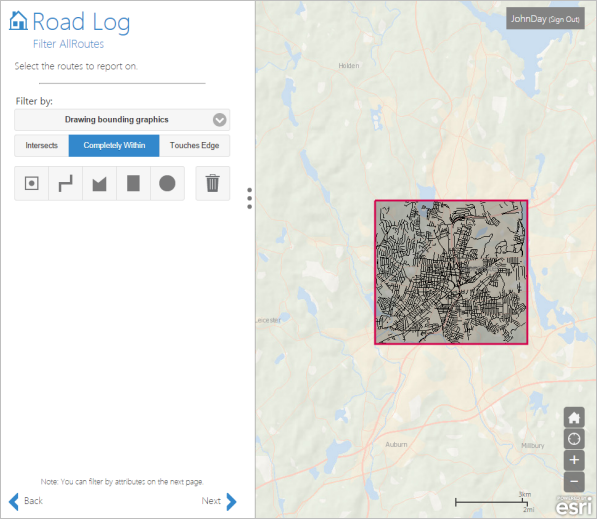
Select routes that are completely within the bounding graphic. - Touches Edge—Routes that touch the edge of the graphic are selected. A route within the graphic but not touching its edge will not be selected.
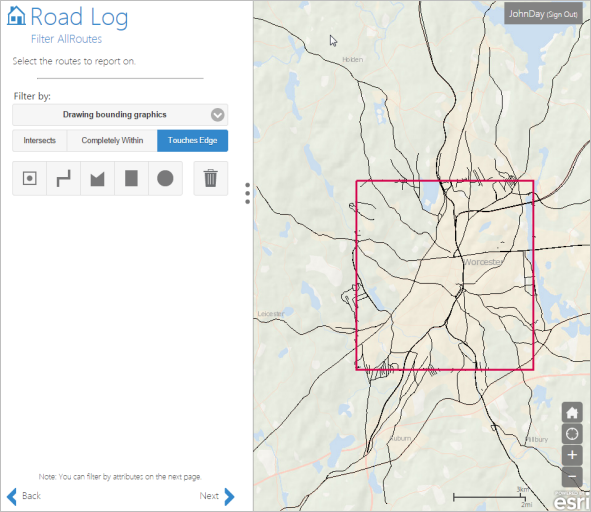
Select routes that are touching the edge of the bounding graphic.
Selecting polygon features
You can use polygon layers available in the map to select routes. For example, if you have administrative boundaries in the map, such as county or town boundaries, you can select the routes that intersect a particular county or town.
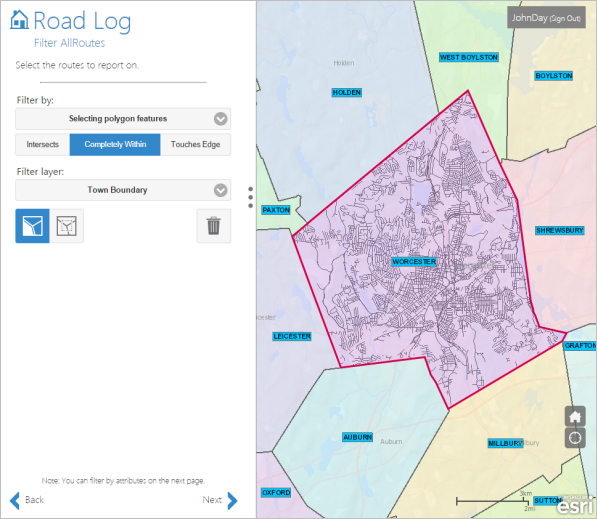
To use polygon features available in the map to select routes, complete the following steps.
- Choose Selecting polygon features from the Filter by list.
- Click the Select by point button
 .
. - Click one or more polygons on the map.
You can also select routes that intersect multiple polygons.
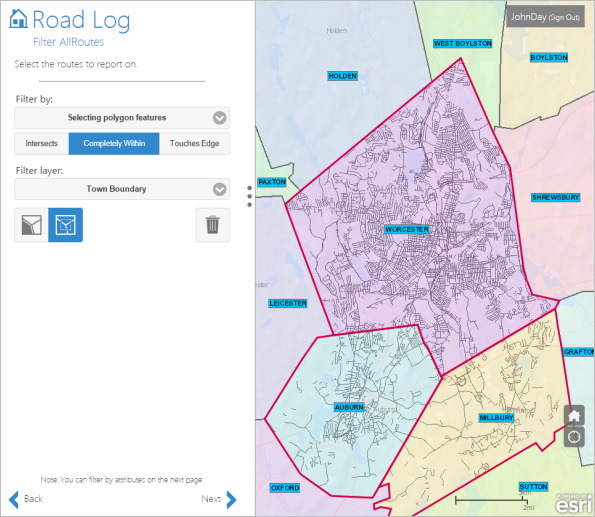
For selecting routes that intersect multiple polygons, complete the following steps.
- Click the Select by rectangle button
 .
. - Draw a box on the map that touches those polygons.
Select by proximity
You can select routes that are within a certain distance from a point located on the map.
- Click the Select the center point button
 .
. - Click the Units drop-down arrow and choose the unit of measure.
- Type a distance for the unit of measure in the Distance text box.
- Optionally filter proximity selection to routes that intersect, fall completely within, or touch the edge of the proximity border.
For example, in the screenshot in step 5, those routes that fall completely within 7 miles are selected.
- Click the map to add a point.
The routes that match the resulting graphic are selected.
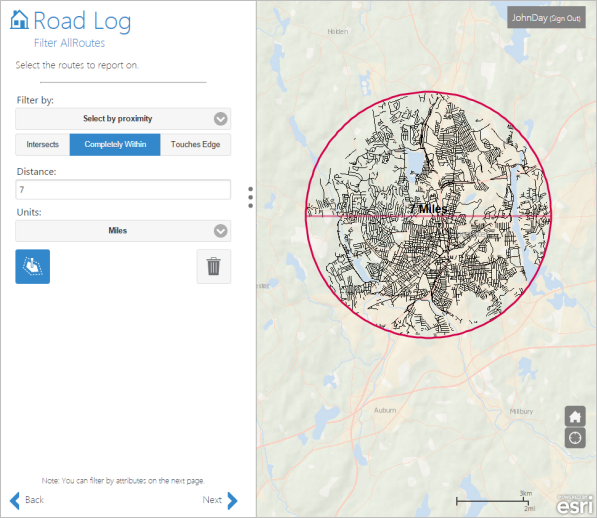
Select routes by proximity..
Select by extent
You can select routes that are within the present extent of the map.
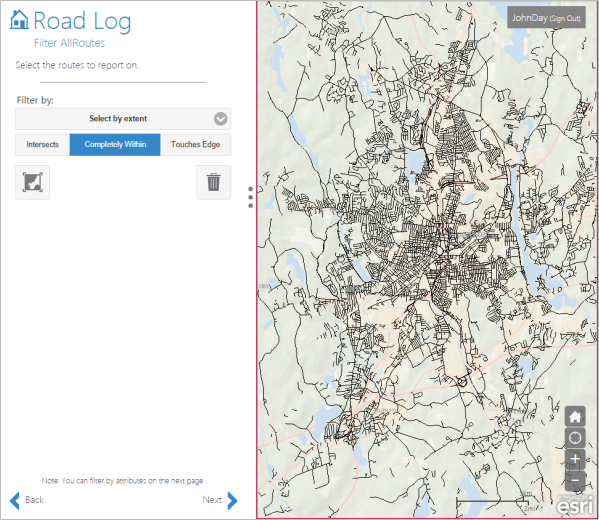
- Click the Select current extent button
 .
. - Cliquez sur Suivant.
Astuce:
After you click Next, the attribute filter tab appears. If you don't want to use attribute filters, you can skip that step by clicking Next again.
Select by route
You can filter routes by route ID either by selecting a route in the map or by typing the route ID.
- Choose Select by route from the Filter by list.
- Click the Select Route button
 to select a route on the map.
 - Click a route on the map to select it.
Astuce:
You can also type the route ID into the Route ID text box.
- Click Next to filter the features by attributes.
Attribute selection
You can select the routes on the basis of attributes available in the network layer that you have selected to produce the report. There are three selection methods available (only when a spatial filter is applied):
Attribute selection options
| Selection method | Description |
|---|---|
Add to current selection | Applies an OR filter to the spatial selection |
Remove from current selection | Applies a NOT filter to the spatial selection |
Select from current selection | Applies an AND filter to the spatial selection |
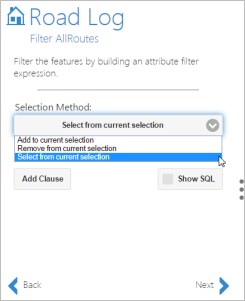
To add an attribute filter, complete the following steps:
- Choose a selection method.
In the example above, Select from current selection is chosen.
- Click Add Clause and choose a field from the network layer to which the filter will be applied.
- Choose the mathematical function and choose the value.
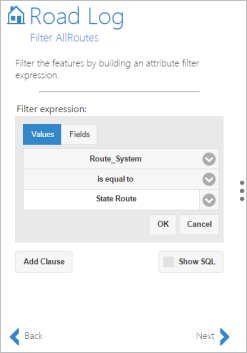
Add an attribute clause. - Click OK.
An attribute selection clause is added.
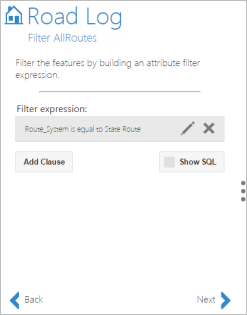
The Attribute selection clause is added. Astuce:
You can add additional attribute selection clauses by clicking Add Clause and applying AND or OR logic to the first clause then following the same procedure as described above to add a second clause.
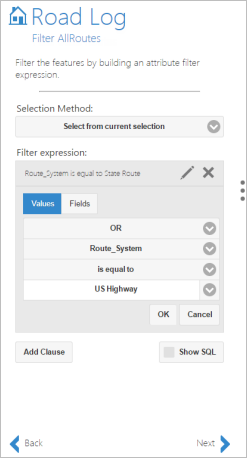
Add a second attribute selection clause. 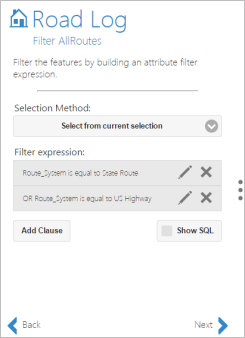
The second attribute selection clause is added. Click the Show SQL button to view or edit the SQL statement.

- Click Next after applying the attribute filter.
Selecting the layers to report
The next stage in creating a road log report is to select the layers from the list of intersection and event layers. Optionally, you can filter the features of each layer by building an attribute filter expression.
- Choose the first layer.
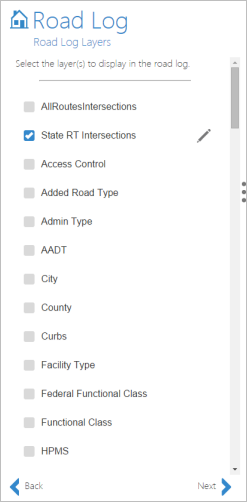
In this example, an intersection layer is chosen. This is a point feature class.
The field selector pane appears to the right.
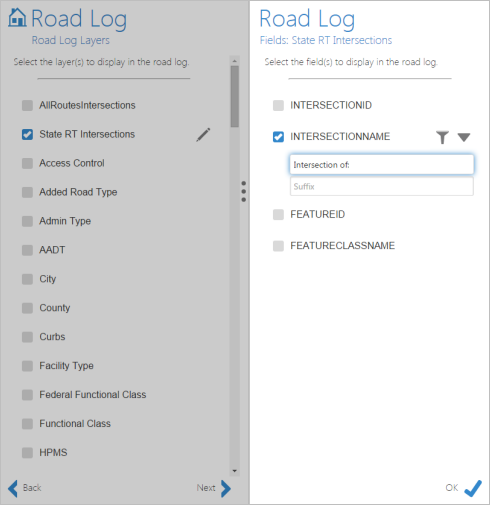
- Choose the field from the selected layer for which you want to report.
- You can choose multiple fields from the same layer.
- To add an attribute filter to the selected field, click the Filter button
 to add an attribute selection clause.
- Cliquez sur OK.
- Choose another event.
- Choose the field or fields for that event.
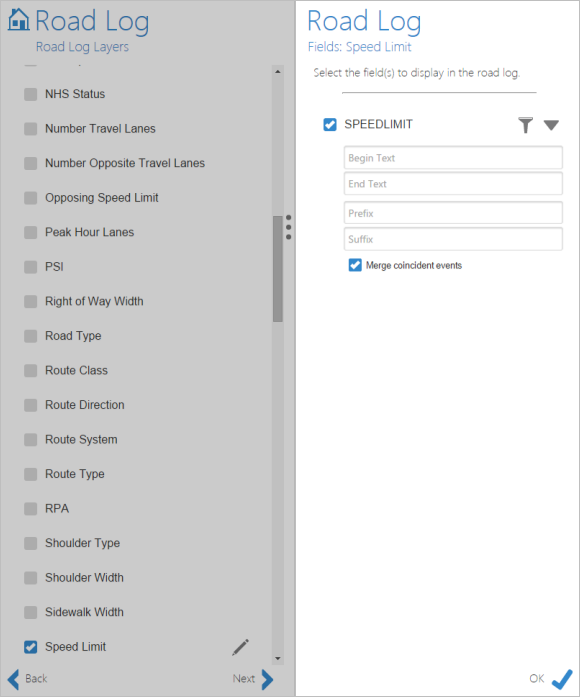
In this example, the linear event Speed Limit is selected. You can add informative text to the data provided by this event. In the third record in the sample report shown previously, the text in the feature column is Starting Speed Limit: 65 mph. The data from the Speed_Limit field in the Speed Limit event is 65, and the rest of the text is added to the record to make it more informative.
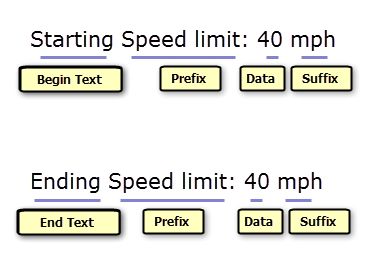
As shown in the previous graphic, the data extracted from the selected field is 40. You can add, for example, informative text such as Starting in the Begin Text box to add to the record whenever a linear event starts, Ending in the End Text box to add to the record whenever a linear event ends, Speed Limit in the Prefix box to add the event's field name, and mph in the suffix box to provide the units for the speed.
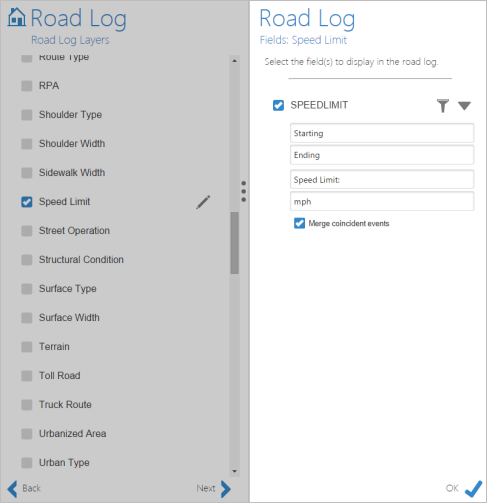
If the Merge coincident events box is checked, the records of adjoining events that share the same data are merged together.
- Click OK.
For this report, two additional road log layers were added: Bridges and Signs.
- Click Next.
Vous avez un commentaire à formuler concernant cette rubrique ?
