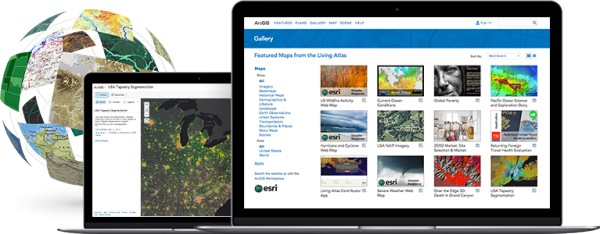
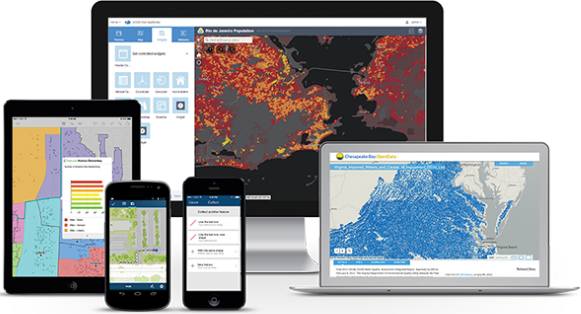
ArcGIS is a web GIS platform that allows you to use, create, and share geographic information throughout your organization, the community, and openly on the web. This information includes maps, scenes, layers, analytics, and apps. Items from different sources can be integrated and combined into new items and shared through websites, mobile apps, and desktops for specific audiences such as citizens, developers, and GIS professionals.
Portal
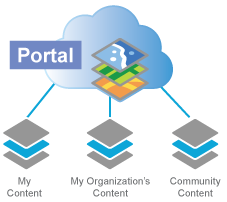
A portal is an organized collection of items. In ArcGIS, items are organized into galleries of content in a custom website that is powered by ArcGIS Online or Portal for ArcGIS. These custom websites are configured and managed by an organization that is made up of members and may be open to the public. There is a gallery for personal content, a gallery for the content owned by the organization, and a gallery of items shared by the ArcGIS community, including Living Atlas of the World. The portal can be stored in the cloud, on a local network, or both. Access to the portal and specific items can be private, public, or a combination of private and public.
Maps and scenes
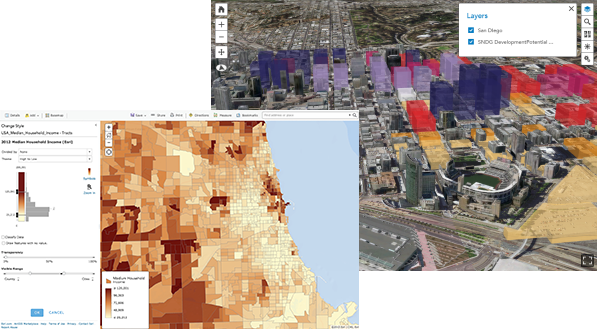
2D maps and 3D scenes are the primary framework for sharing geographically referenced data. They are recognized user interfaces and can be viewed by anyone with a web browser, mobile device, or desktop. Every map and scene contains a basemap, which provides geographic context, and a set of data layers. Maps are used to show 2D data such as population change. Scenes are similar to maps in that they combine a basemap with operational layers, but scenes bring in the third dimension, the z-axis, which allows you to control things like lighting, camera tilt, and angle of view. Scenes can help you understand trends and growth projections from a new perspective because relationships that might be hidden in 2D maps can stand out in 3D. Both maps and scenes are mechanisms not just for displaying and viewing information but also quantifying and measuring information.
Layers
Layers are logical collections of geographic data such as water mains, hydrants, and other features in a water utilities solution, or emergency facilities and city streets in a solution designed for public safety. They are how geographic data is organized and combined to create maps and scenes; they are also the basis for geographic analysis. Within your portal, you work with your data through layers. You can configure properties such as editing permissions and create copies of layers to create different visualizations. For example, a healthcare data layer aggregated by hospital service areas likely contains attributes for many types of diseases. You could create a copy of the layer and stylize the data on the rate of depression. You could create another copy of the layer and stylize that on the rate of Alzheimer's.
Analytics
Analytics allows you to identify patterns in data. Stacking layers that contain different kinds of data and comparing them to each other based on where things are located is the foundational concept of spatial analysis. Within the same geographic space, you often have layers of data about the real world, elevation, land use, parcels, streets, and political boundaries. 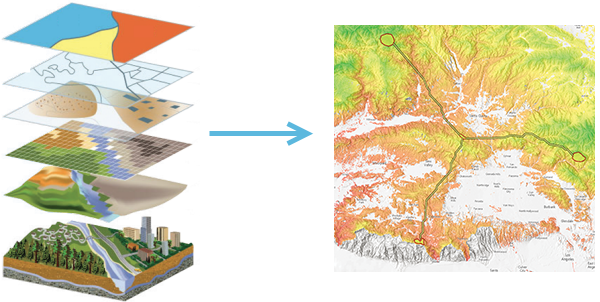
ArcGIS includes a large set of modeling functions that produce analytical results. These typically generate new data layers and associated tabular information in your GIS, enabling you to use ArcGIS to model a variety of spatial problems and share your results. Analytics includes built-in spatial analysis tools in the map viewer as well as locator and geoprocessing packages you can add to your portal.
Apps
Apps are lightweight map-centric computer programs with focused workflows and tools for a specific audience. They can be used for tasks such as tracking assets in the field, finding new retail locations, and configuring sites to collect public input. Some apps are designed to work on mobile devices, in web browsers, or on desktops, and some apps can run in any of these environments. Apps can be hosted as a part of your portal or they can be managed independently.
Where can you find geographic information?
The mission of many GIS organizations is to perform specific functions within its jurisdiction. Each of these departments, groups, or agencies is committed to building key authoritative data layers to support its work. This work includes the compilation of foundational data layers as well as standard basemap layers for their geographies and applications. An increasing amount of this authoritative data is available through Living Atlas of the World, an active network of contributors and curators. It includes imagery, basemaps, boundaries and places, transportation, earth observations, urban systems, and historical maps. As a user of a portal, you can combine content from this repository with your own data to create maps, scenes, and apps and perform analysis.
