GeoPlanner dashboard gauges display the current value of a key performance indicator (KPI). KPIs measure a value that demonstrates progress toward a goal or objective. KPIs are defined as equations that include attributes within scenarios, constants, and simple mathematic operators. GeoPlanner dashboards can include multiple gauges. Gauges display KPI data that pertains to the currently active scenario.
The GeoPlanner dashboard can be configured with one or more gauges, each of which displays a numeric value representing a quantitative key performance indicator of your plan. The value shown in each gauge is calculated by an equation that is used to derive the current value of a defined plan performance metric. These equations for calculating plan metrics support the combination of individual feature attribute values from the Active Scenario, constants, and a variety of simple arithmetic operators.
The following steps describe how to create a new gauge.
- On the toolbar on the map, click the Dashboard button.
- Click the Global Settings icon in the upper left corner of the dashboard and choose Add a Performance Indicator from the dropdown menu.

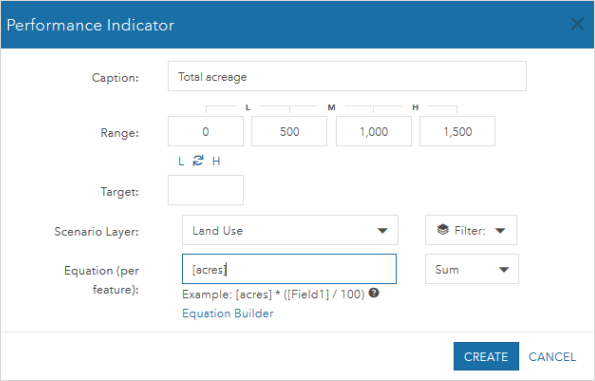
- On the Performance Indicator dialog box, type a caption in the Caption field. This text will display in the dashboard widget's drop-down menu. It should be a short descriptor that easily identifies the performance indicator metric that the gauge will be used to display.
- Enter the anticipated range of your performance indicator values in the Range fields. You must enter a high and low end, and optionally, you can also enter two additional mid-values to be displayed on the gauge. The range dial on the gauge will be color-coded from red to green, by default. Clicking the L-H toggle key will reverse color coding in the gauge display.
- Click the Scenario Layer drop-down menu and choose the scenario layer from which the metrics will be computed.
- Optionally, click the Filter drop-down menu and choose a subset of feature types to include in the calculation of the metric. All types are included by default.
- Click Equation Builder to display an equation builder dialog. Equations can include fields (in brackets) from a scenario layer, constants, area or length units, and simple mathematic operators. Equations are evaluated once per feature. See the Build gauge equations and Examples sections below for more information.
- Optionally, click the Sum drop-down menu and choose either Sum or Average. This choice indicates whether values will be totaled or averaged for all features calculated in the gauge.
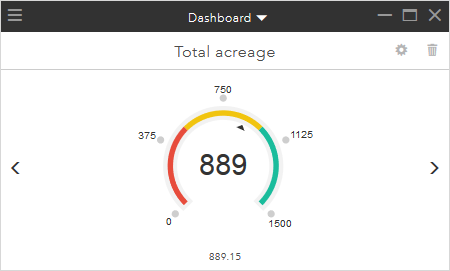
This KPI displays total acreage in the active scenario. - Click Update. A new gauge is created and added to the dashboard.
Build gauge equations
Building equations to calculate quantitative performance indicators from your plans can require as little as referencing a single attribute or constant (for example, acres of specific land-use type). It can also compute from multiple attributes and constants (for example, tax revenue potential taking into account percentage of land-use types, floor-to-area ratio, and taxable rate by land-use type). Example syntax is shown beneath the Equation text box. Equations are evaluated once per feature. Results are totaled or averaged for all features to produce a single KPI value that is displayed in the gauge. The following rules apply to equations:
- Attribute names must be enclosed in brackets, for example, [Floor Area Ratio].
- Attribute names must match either the actual field name or its alias in the project feature service, for example, [Floor Area Ratio] or [FAR].
Note:
You can locate the project feature service by clicking the Open Menu button in the upper left corner of the app and choosing Details in the Project Backstage. On the View Details dialog box, click Details. This will open a new browser tab on ArcGIS.com in the project group. Scroll through the list of items until you see a feature layer with a title that includes the words project feature service.
- Addition, subtraction, multiplication, and division (*,/,+,-) operators are supported.
- The following units will generate a feature's area:
- [acres]
- [squarefeet]
- [squaremiles]
- [hectares]
- [squaremeters]
- [squarekilometers]
- The following units will generate a feature's length:
- [feet]
- [miles]
- [meters]
- [kilometers]
- Area and length units must be enclosed in brackets.
- Use parentheses to group expressions and control execution order.
Null values
During evaluation, if an equation encounters a null value, the entire equation will be disqualified from processing. For example, you create a gauge that uses the equation ((([squarefeet]*[LotCoverage])*[stories])*[residentialfactor])/1000 to calculate the buildable residential area of a lot. There are 10 scenario features. If 5 of these features have nulls for any of the attribute values (LotCoverage, stories, or residentialfactor), each of those 5 features will be disqualified from the calculation of the metric in the gauge. For best results, calculate your null values to 0 (or another value representing null in your industry), and always specify a default value for your attributes in your GeoPlanner template.
Examples
The following examples are based on attributes found in the GeoPlanner Template for Land Use Planning. Each example shows a gauge and its properties. These examples are for instructional purposes only.
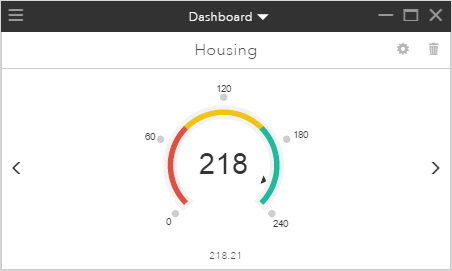
The following gauge estimates the number of dwelling units in a plan by multiplying dwelling unit per acre attribute values by each feature's area in acres: [DWELLING UNIT PER ACRE] * [ACRES].[DWELLING UNIT PER ACRE] is an attribute alias name.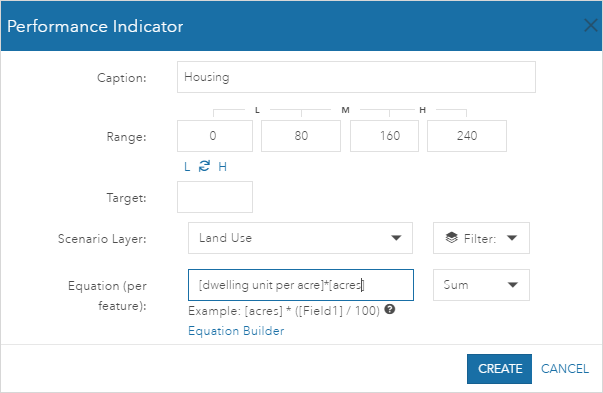
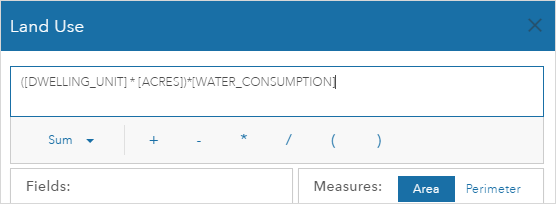
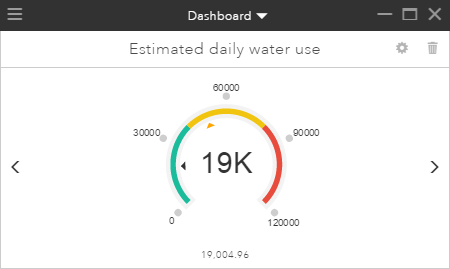
The following gauge estimates daily water usage per household by multiplying dwelling unit per acre attribute values by each feature's area in acres, and then multiplying the result by daily water consumption attribute values: ([DWELLING_UNIT] * [ACRES])*[WATER_CONSUMPTION]. Attribute field names are used instead of alias names. A target of 50,000 is set and the low-high ranges are reversed to indicate that lower values are preferable to higher.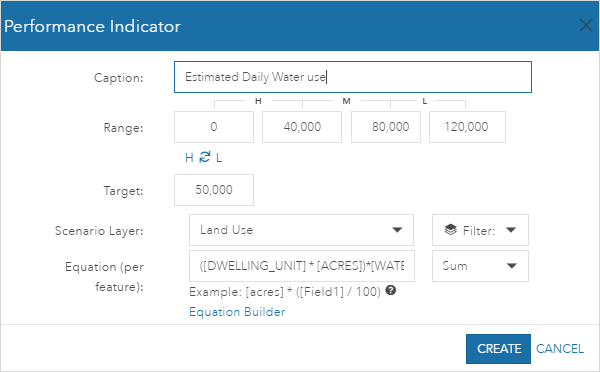
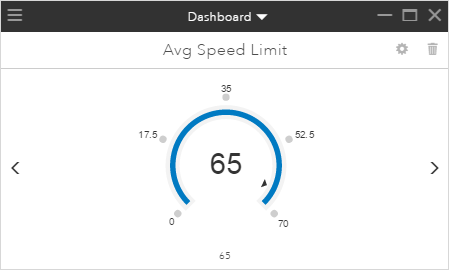
The following gauge displays the average speed limit for all roads in a plan by averaging the speed limit attribute value: [SPEED_LIMIT]. The equation operation is set to Average and only two range values (low and high) are specified.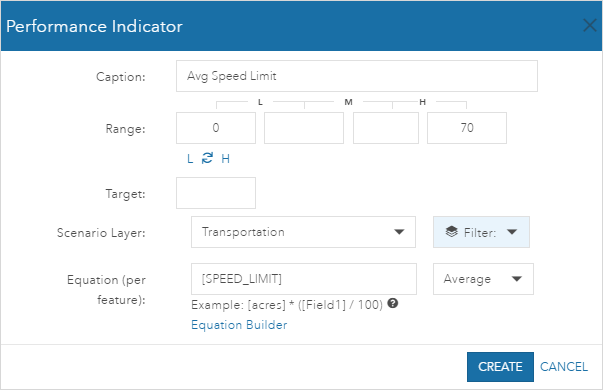
Update or delete a gauge
You can update a gauge by clicking the gear icon in the upper right corner of the gauge. This will display the Performance Indicator dialog box. This dialog box allows you to set all configuration properties of the indicator.
You can delete a gauge by clicking the trash can icon in the upper right corner of the gauge. This will remove the gauge from your project. It will not remove a gauge from a shared dashboard.