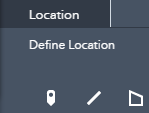
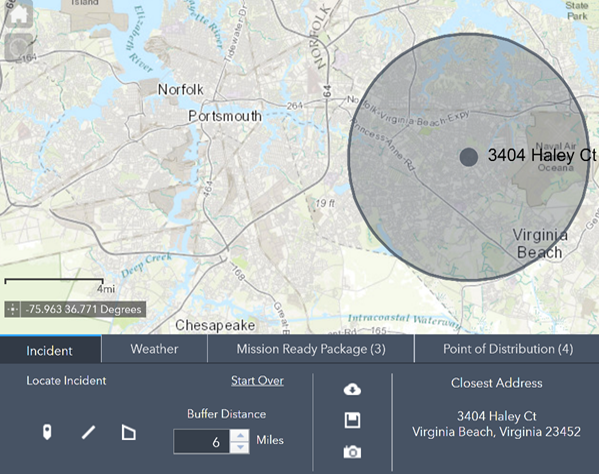
The Situation Awareness widget allows you to locate an incident on the map and analyze information from different feature layers within a specified incident area.
Configuring the Situation Awareness widget
The Situation Awareness widget can be set to open automatically when an app starts. To do so, click the dot on the widget to turn it dark green.
- Hover over the widget and click the small edit icon
 . The configuration window for this widget appears.
 - Optionally, click the change widget icon button and replace it with your own image. A file explorer window appears, allowing you to choose a local image file to use as the widget icon.
- Click Add Tab. Each tab allows you to specify a feature layer in the map and the type of analysis using one of the following options:
- Summary—A summary of numeric fields from the selected layer.
- Proximity—A list of features from the layer that are within the specified area.
- Closest Feature—The closest feature to the location.
- Grouped Counts—A count of features within the specific area, grouped by a specified field. Note, if the Grouped Counts option is selected, Group By Field is required. Click the edit button under Actions to define Group By Field.
- Optionally, a label can be specified for each tab.
- To specify fields to be included in the analysis, click the Edit tool under Actions to open the Select Fields window.
- Optionally, check Display feature count to see a count added to each tab in the panel.

- Optionally, change the order of tabs or delete a tab under Actions.
- In the General Settings section of the configuration window, you can specify the following options:
- Tab label—Specify a label for the tab in the widget. The default is Incident.
- Area of interest label—Specify a label for the area under the tab. The default is Locate Incident.

- Distance units—Select the units to be used for Proximity and Closest Feature analysis, as well as when providing a buffer distance for analysis.
- Enable routing—Check this option to enable routing from the incident to the feature. The Directions widget is also required to generate routes.
- Closest feature maximum distance—The maximum distance to use when searching for the closest feature.
- Buffer label—Optional label for the buffer distance.
- Minimum buffer distance—Minimum distance allowed to buffer incidents.
- Maximum buffer distance—Maximum distance allowed to buffer incidents.
- Under Weather Options, check the Include weather information option if you want to display current and forecasted weather conditions at the incident location. You can also use the select weather layers button to select any weather related layers—such as radar or precipitation—from the currently selected web map that need to be displayed on the map when the Weather tab is selected.
- Under Save Options, check the Enable save option to allow users to add or delete features from the feature service. Check Save points, Save lines, or Save polygons, and specify the layer for each selected type.
- The Export all fields in the layer option, which includes all fields in the layer when exporting to a CSV file, is checked on by default. If you want to only include the fields configured in the Select Fields window for summary, grouped counts, or proximity analyses, uncheck this option.
- Under Display Options, choose Display summary features if you want to show these features on the map when the corresponding summary analysis tab is selected.
- Under Snapshot Options, Enable snapshot enables the ability to create a snapshot of the configured application layers at a specific moment in time. This behavior requires specific permissions from the user who should have privileges to create, update, and delete the content as well as publish hosted feature layers.
Using the Situation Awareness widget
- Click the Situation Awareness widget icon to open it. The widget displays at the bottom of the map.

When the Situation Awareness widget opens, the visibility is turned off for all map layers that have been configured as source layers for the widget. These layers are made visible when used by the widget. When the widget is turned off, layer visibility is returned to its original state.
- The Incident tab is selected by default.
- Define a location in one of the following ways:
- Click an existing feature and choose Set Location in the feature's pop-up window.
- Use the drawing tools on the widget's Incident tab to create a new location to analyze.
- Optionally, specify a buffer distance to the location.
- To download summarized information, click Download all
 .
. - To save the location to the feature service, click Save
 .
. - To create a snapshot of the location and analyzed information, click Create snapshot
 .
. - Click the layer tabs to view the analyzed information for specific layers. You can scroll the widget panel horizontally to view additional results.
- Optionally, click Download
 to download analyzed data as a CSV file.
 - Optionally, if routing is enabled and the Directions widget has been added to the app, click the directions icon to get directions from the incident to the feature. For line and polygon incidents, enter an appropriate starting point directly in the Directions widget.
- To clear the active location, click the Start Over option.
- To close the widget, click the Close button in the upper right corner of the widget.