Available with Image Server
A color 3D representation of the terrain is created by merging the images from the elevation-coded and hillshade methods. This function uses the altitude and azimuth properties to specify the sun's position.

Notes
Unit conversion
If the units for the z (elevation) units are the same as the x,y (linear) units, then the z conversion factor is 1. If your dataset is using a projected coordinate system, your scaling is set to None, and your elevation and linear units are different, then you will need to define a z conversion factor to account for the difference.
To convert from feet to meters or vice versa, see the table below. For example, if your DEM's elevation units are feet and your mosaic dataset's units are meters, you would use a value of 0.3048 to convert your elevation units from feet to meters (1 foot = 0.3048 meters).
| Conversion type | Conversion factor |
|---|---|
Feet to meters | 0.3048 |
Meters to feet | 3.28084 |
If your data is using a geographic coordinate system (such as a DTED in GCS_WGS 84), where the linear units are in degrees and your elevation is in meters, use a conversion factor of 1, and the system will automatically convert your linear degrees to meters. If your elevation units are not in meters, use the Unit Conversion function to convert your elevation to meters before using this function.
Note:
When your scaling is set to Adjusted, you can use the Z Factor to convert z units to meters, and ArcGIS will automatically adjust the latitude and longitude to meters.
Vertical exaggeration
To apply vertical exaggeration, you must multiply the conversion factor by the exaggeration factor. For example, if both elevation and dataset coordinates are meters and you want to exaggerate by a multiple of 10, the scaling factor would be the unit conversion factor (1.0) multiplied by the vertical exaggeration factor (10.0)—which would be a Z Factor of 10. If the elevation units are meters and the dataset is geographic (degrees), you would multiply the unit conversion factor (1.0) by the exaggeration factor (10.0)—which would be a Z Factor of 10.
Parameters
The inputs for this function are the following:
| Parameter | Description |
|---|---|
Raster | The input elevation dataset. |
Color Scheme Type | Specify whether a color ramp or a color map will be used to display the shaded relief.
|
| Hillshade Type | Controls the illumination source for the hillshade.
|
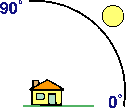
| Azimuth | Azimuth is the sun's relative position along the horizon (in degrees). This position is indicated by the angle of the sun measured clockwise from due north. An azimuth of 0 degrees indicates north, east is 90 degrees, south is 180 degrees, and west is 270 degrees. |
| Altitude | Altitude is the sun's angle of elevation above the horizon and ranges from 0 to 90 degrees. A value of 0 degrees indicates that the sun is on the horizon, that is, on the same horizontal plane as the frame of reference. A value of 90 degrees indicates that the sun is directly overhead. The default is 45 degrees above the horizon.  |
| Scaling | The shaded result is scaled dynamically by adjusting the z-factor using one of two options:
|
| Z Factor | The z-factor is a scaling factor used to convert the elevation values for two purposes:
|
| Pixel Size Power | Pixel Size Power accounts for the altitude changes (or scale) as the viewer zooms in and out on the map display. It is the exponent applied to the pixel size term in the equation that controls the rate at which the Z Factor changes to avoid significant loss of relief. This parameter is only valid when the Scaling type is Adjusted. The default value is 0.664. |
| Pixel Size Factor | Pixel Size Factor accounts for changes in scale as the viewer zooms in and out on the map display. It controls the rate at which the Z Factor changes. This parameter is only valid when the Scaling type is Adjusted. The default value is 0.024. |
| Disable default edge pixel interpolation | Specify whether the default edge pixel interpolation will be disabled.
Using this option will avoid any resampling artifacts that may occur along the edges of a raster. The output pixels along the edge of a raster or beside pixels without a value will be populated with NoData; therefore, it is recommended that this option be used only when there are other rasters with overlapping pixels available. When overlapping pixels are available, these areas of NoData will display the overlapping pixel values instead of being blank. |