You are using layer transparency, which applies dynamic transparency to all the map layer's contents. Unlike ArcMap, map services support color transparency, and enabling a conversion of layer transparency to color transparency in the Prepare window can improve the performance of your map. However, the use of color transparency may alter the appearance of your map.
Solutions
Check the drawing performance of your basemap layer in ArcMap or your map service in the Preview window.
Learn more about working with basemap layers or previewing your map service
- If no changes are needed, you can use the map display as is.
- Alternatively, if you want to improve performance, enable the option to convert layer transparency to color transparency in the Prepare window by right-clicking the message. After enabling the option, preview your map for possible appearance changes.
More information
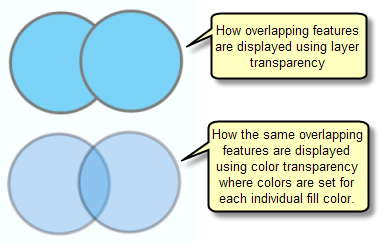
Map services use a graphics engine that provides differences in drawing performance for some aspects of your maps. Pushing transparency from the layer to each of its symbol's colors results in better drawing performance. However, color transparency has a side effect of blending colors that overlap as shown below. Therefore, your cases should be previewed before creating a map service to get the desired portrayal and to balance this with your map performance goals.

Drawing behavior in the new display engine used by a map service is significantly faster. However, when you use transparent fills in multilevel symbols (referred to in ArcMap as symbol-level drawing), some features may not appear as you expect.
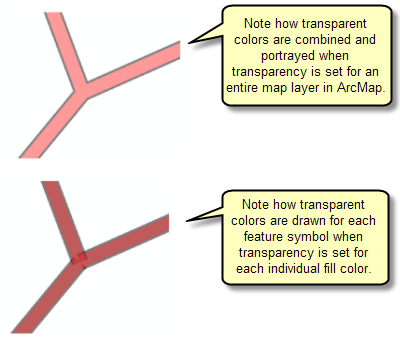
For example, here are three lines, each drawn with a multilayer line symbol—a transparent color and a road casing that is about 1 point wider than the color fill.

You can see how the overlapping transparent colors show up when you use transparent color fills. In these cases, switch to using a solid fill to portray your roads more effectively.