Monitoring the GeoEvent Extension
En este tema
- Setting rate thresholds
- Monitoring GeoEvent Services
- Monitoring inputs and outputs
- Resetting statistics
- Starting and stopping inputs, outputs, and GeoEvent Services
- Access input, output, and GeoEvent Service properties
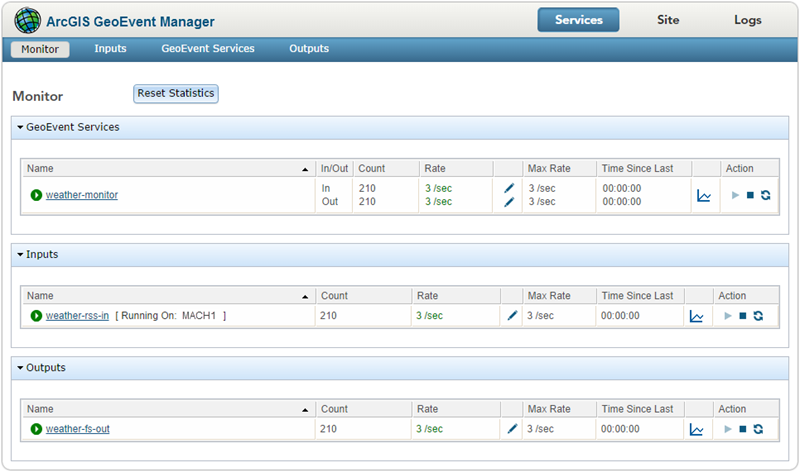
The GeoEvent Extension can be monitored by viewing the Services > Monitor page in GeoEvent Manager. The data rates for all inputs, outputs, and GeoEvent Services can be monitored in real time, allowing you to quickly evaluate the current status as well as identify potential issues.

The Monitor page should be the first resource referenced when troubleshooting a data streaming issue. The counts will indicate whether the input is receiving and handling events from the source, whether the GeoEvent Service is processing the events, and whether the output is sending events to the appropriate output.
Nota:
The count for each input and output only shows the number of GeoEvents handled by a connector, whereas the GeoEvent Service displays the number of GeoEvents received (In) and the number sent (Out). A GeoEvent Service may contain multiple inputs and outputs, which is why the number of GeoEvents in or out of a GeoEvent Service may differ from the count for a particular input or output.
Setting rate thresholds
Rate thresholds are an important feature for monitoring the GeoEvent Extension. Minimum and maximum rate thresholds can be set for the flow of GeoEvents through specific inputs, outputs, and GeoEvent Services. These thresholds are user defined and intended to reflect the expected behavior of each input, output, or GeoEvent Service under normal operating conditions. Setting appropriate minimum and maximum expected rates allows you to quickly see whether a particular component is behaving as expected. If data rates are within the expected bounds, the rate appears green. If data rates are outside the expected bounds, the rate appears red. This gives you immediate visual feedback when the system is behaving unexpectedly.
Max rate and time since last
The Monitor page includes statistics for the maximum observed rate and the time since the last GeoEvent was handled by each input, output, and service. These statistics help administrators identify unusual spikes or absences of streaming data.
Rate (over the last 5 minutes)
The Monitor page includes a rate statistic for the average number of events handled by each component over the last five minutes. This statistic is useful for data streams that have been running for a period of time, since the average rate for an input that has just started may be artificially low.
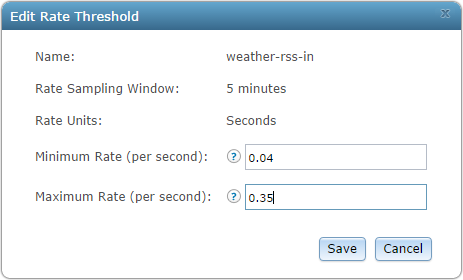
Configure the rate threshold values for the number of events expected per second for any input, output, or service by clicking the Edit button to the right of the rate statistic. If the rate falls below a specified minimum, or exceeds a specified maximum, the color of the statistic will change to indicate the rate is outside an expected range. Setting event rate thresholds allows you to quickly see whether an input, output, or service is handling the expected number of GeoEvents.

Nota:
The sampling rate is fixed at 5 minutes (300 seconds) and is not editable. The rate will be reported as an average number of events received, sent, or handled per second.
Average rate (over last 5 minutes)
By default, the statistics on the number of events received, sent, or handled by an input, output, or service are not reset and will continue to grow. The statistics can be reset, which will clear all metrics for inputs, outputs, and services (count, average rate, max rate, and time since last). To reset the statistics, click the Reset Statistics button at the top of the Monitor page.
Monitoring GeoEvent Services
Individual GeoEvent Services, which themselves may contain multiple inputs and outputs, can be monitored as a single entity. Each GeoEvent Service has an inbound data rate and an outbound data rate, which are reported in average GeoEvents per second over a time period. For each data rate (in and out) from each GeoEvent Service, minimum and maximum rate thresholds can be set, as described below. Other statistics are also shown for each GeoEvent Service (in the inbound and outbound directions), including the total event count, the maximum rate observed, and the time since the last GeoEvent was observed. Clicking View Activity Graph for a particular GeoEvent Service opens a new window that displays an activity graph illustrating the rate of GeoEvents per second over a period of time for each component in a GeoEvent Service. Statistics can be reset as described below.
Monitoring inputs and outputs
Statistics for individual inputs and outputs can be monitored. Data rates are reported in average GeoEvents per second over a time period. For each input and output, minimum and maximum rate thresholds can be set, as described below. Other statistics are also shown for each input and output, including the total count, the maximum rate observed, and the time since the last GeoEvent was observed. Clicking View Activity Graph for a particular input or output opens a new window that displays an activity graph illustrating the rate of GeoEvents per second over a period of time for an input or output. Statistics can be reset as described below.
Resetting statistics
By default, statistics collected by GeoEvent Extension are never reset. Statistics such as total GeoEvent counts continue to grow indefinitely. Sometimes it could be useful to reset the statistics captured by the GeoEvent Extension so you can collect statistics for a well-known time period under a specific set of conditions. A Reset Statistics button is provided for this purpose. Resetting the statistics will reset all current statistics and the GeoEvent Extension will begin capturing new statistics.
Starting and stopping inputs, outputs, and GeoEvent Services
The current status for all inputs, outputs, and GeoEvent Services can be viewed on the Services > Monitor page in GeoEvent Manager. Starting, stopping, and restarting inputs, outputs, and GeoEvent Services is done individually.
All components can be started, stopped, and restarted from the Monitor page by clicking the Start, Stop, and Restart buttons for any inputs, outputs, or GeoEvent Services.

Nota:
Optionally starting, stopping, and restarting inputs, outputs, and GeoEvent Services can also be performed from the Inputs, GeoEvent Services, and Outputs pages in GeoEvent Manager.
Access input, output, and GeoEvent Service properties
Using the Monitor page in GeoEvent Manager, access the properties of your inputs, outputs, and GeoEvent Services by clicking the respective item from the lists. The properties dialog box will appear, allowing you to edit and save any changes.
Nota:
The properties for inputs, outputs, and GeoEvent Services can also be accessed from the Inputs, GeoEvent Services, and Outputs tabs in GeoEvent Manager.