Mileage reports are used to report mileages on routes based on their length and summarized by their characteristics. For example, there could be a mileage report that shows the miles of pavement of type of asphalt, concrete, and bituminous present in each county in a state. For more information, see Mileage reports in Roadway Reporter.
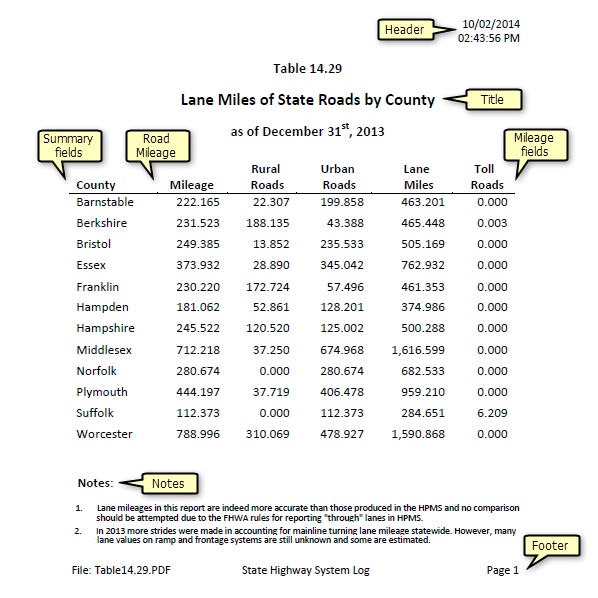
In this workflow, you'll learn how to produce a mileage report similar to the one shown above. The mileages and summaries are calculated using internal event layers that are part of the LRS.
Data required
The following data layers are used to create the report. The layer names used here are for information only. You can use your own layer names to produce your reports.
Data layers used to create the mileage report
| LRS data type | Layer name | Explanation |
|---|---|---|
| LRS Network layer | MilePoint | The routes are selected from this layer. The mileage is calculated on the selected routes. |
| Internal linear event layer | County | The summary layer used to calculate countywide mileage of the routes. |
| Internal linear event layer | Urban_Type | The rural and urban type mileage is calculated from this layer. |
| Internal linear event layer | Number_Travel_Lanes | The lane miles are calculated from this layer. |
| Internal linear event layer | Toll | The amount of toll miles is calculated from this layer. |
Producing a mileage report
A mileage report can be configured using the following steps:
Selecting the network
The first step toward producing a mileage report is to select the route network.
- Open the Roadway Reporter application in your browser.
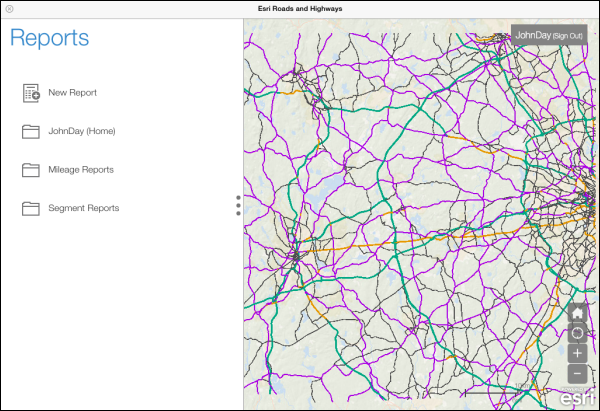
- Click the New Report button
 .
.
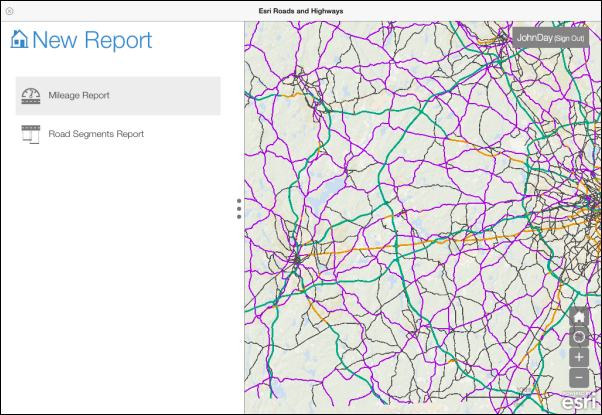
- Click the Mileage Report button
 .
.
Create a new mileage report - Click the Route Network drop-down arrow and choose a route network.
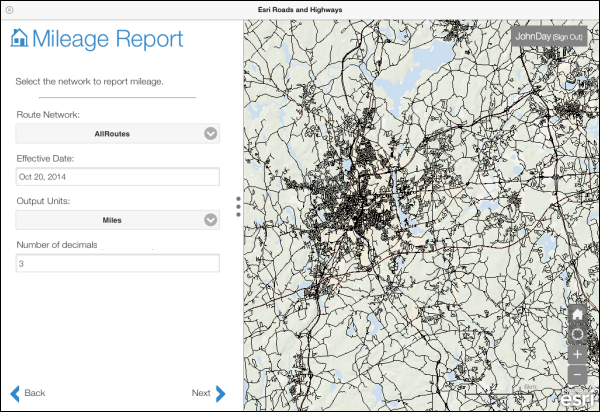
- Type a date in the Effective Date text box for the report.
This is the point in time that represents the state of the roadway network for which you want to report mileage.
- Click the Output Units drop-down arrow and choose the units for the report.
The mileage is reported using these units.
- Type a value in the Number of decimals text box.
This is the number of decimals that appear in the mileage in the report.
- Klicken Sie auf Weiter.
Selecting the routes
The next step in the mileage report creation process is to select the routes for which the mileage will be calculated. There are two options available:
- Spatial selection
- Attribute selection
Spatial selection of routes
The following spatial selection tools are available to select routes:
- Drawing bounding graphics—You can select routes by drawing graphics on the map. To do so, select a drawing tool such as Select By Rectangle
 and draw the rectangle graphic on the map.
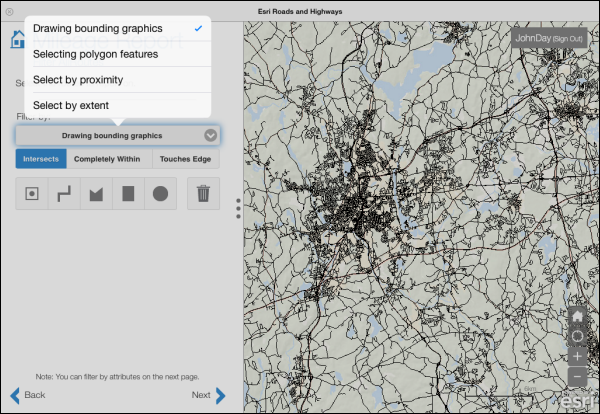
Spatial selection by drawing bounding graphics Drawing bounding graphics tools
Tool button Description 
Select routes by point.

Select routes by drawing a line.

Select routes by drawing a polygon.

Select routes by drawing a rectangle.

Select routes by drawing a circle.

Clear selection.
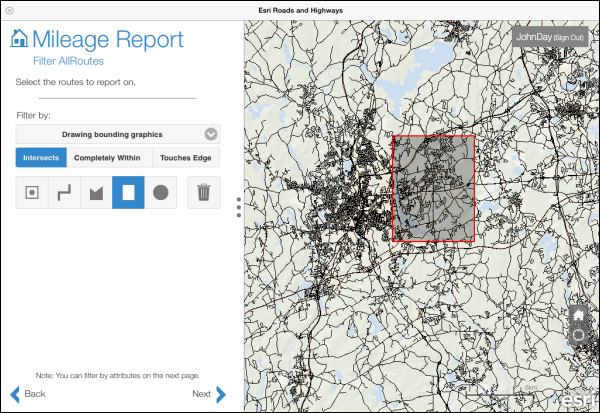
Route selection by a drawing a rectangle Before you draw the bounding graphic or use any other spatial filtering tools, you have the option to apply the filter in three ways:
- Intersects—The routes that intersect the graphic are selected.
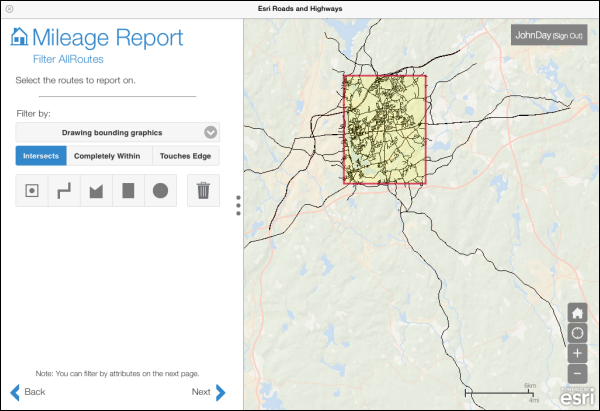
Routes that intersect the graphic - Completely Within—Routes completely within the graphic are selected.
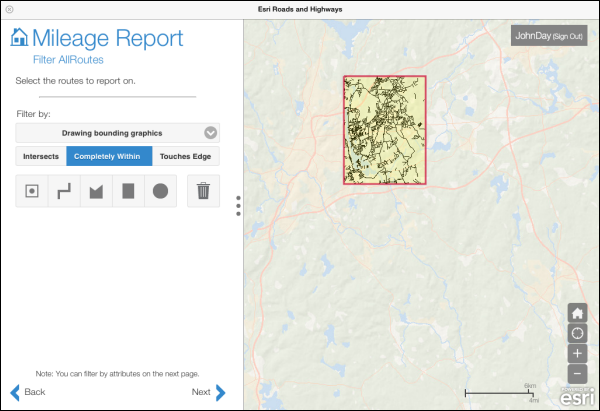
Routes that are completely within the graphic - Touches Edge—Routes that touch the edge of the graphic are selected. If a route is within the graphic, it will not be selected because it is not touching the edge.
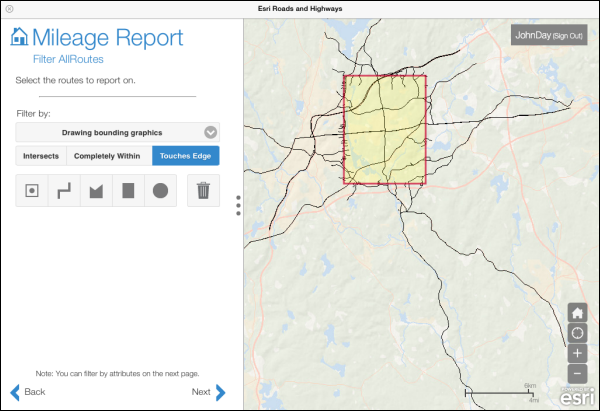
Routes that are touching the edge of the graphic
- Intersects—The routes that intersect the graphic are selected.
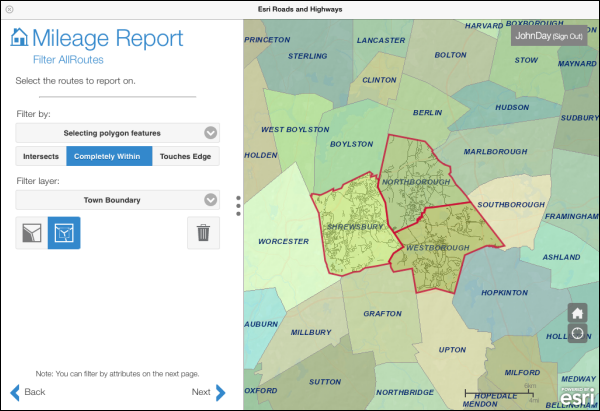
- Selecting polygon features—You can use polygon features available in the map to select routes. For example, if you have administrative boundaries in the map, such as county or town boundaries, you can select the routes that intersect a particular county or town. To do so, select the polygon layer from the Filter layer list, click the Select Polygon tool
 , and click one or more polygons on the map.
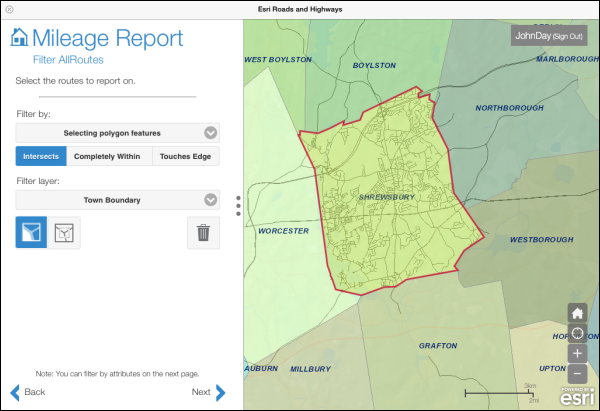
Selecting routes that intersect a town boundary For selecting routes that intersect multiple polygons, click the Select Multiple Polygons tool
 and draw a box on the map that touches those polygons.
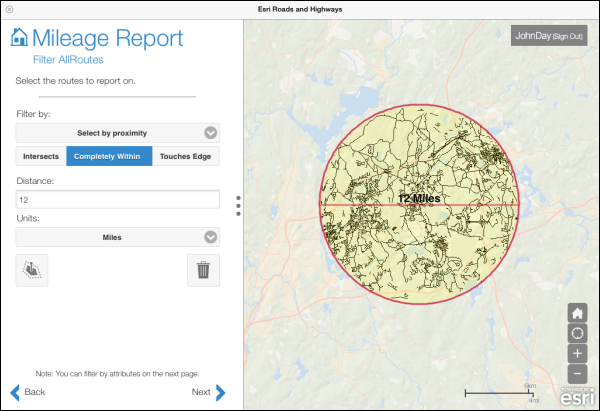
Selecting routes that intersect multiple town boundaries - Select by proximity—You can select routes within a certain distance from a point located on the map. When doing so, provide the distance and select the Units using the drop-down arrow. Click the Select By Proximity tool
 and click the map to add a point. The routes that intersect the resulting graphic are selected.
Selection by proximity - Select by extent—You can select routes within the present extent of the map. To do so, click the Select By Extent tool
 .
.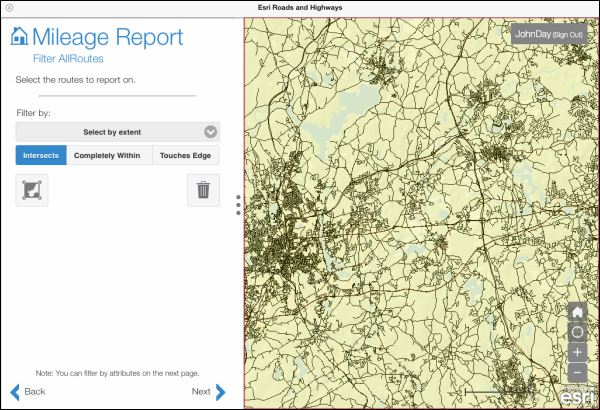
Selection by map extent
Attribute selection
You can select the routes on the basis of attributes available in the network layer that you have selected to produce the report. If you want to select all the routes in your data to be used for reporting, do not apply any spatial or attribute filters. There are three selection methods available (only when a spatial filter is applied).
Attribute selection methods
| Selection method | Description |
|---|---|
| Add to current selection | Applies an OR filter to the spatial selection |
| Remove from current selection | Applies a NOT filter to the spatial selection |
| Select from current selection | Applies an AND filter to the spatial selection |
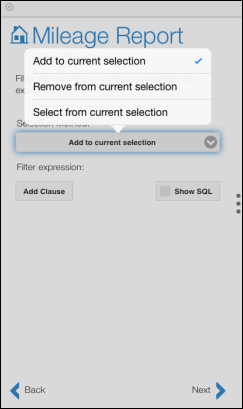
To add an attribute filter to the routes:
- Choose a selection method.
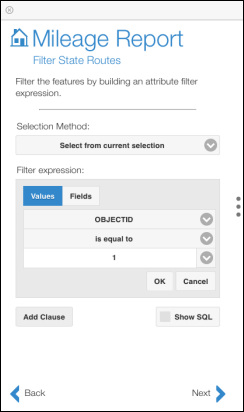
Attribute selection method chosen - Click Add Clause and choose a field from the network layer to which the filter will be applied.
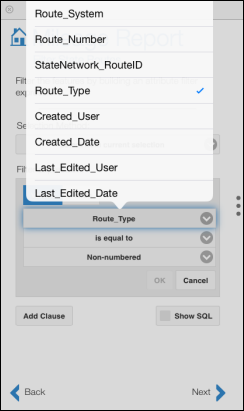
Choosing a field from the network layer - Choose the logic operator and choose the value.
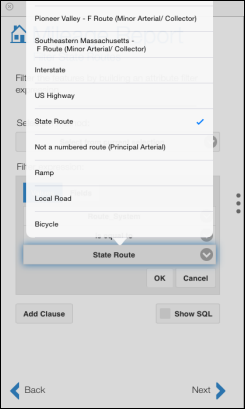
Choosing the field value 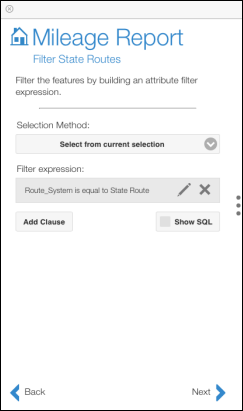
An attribute selection clause is added Hinweis:
You can add more attribute selection clauses using the following procedure by clicking Add Clause and choosing whether to apply AND or OR logic to the first clause.
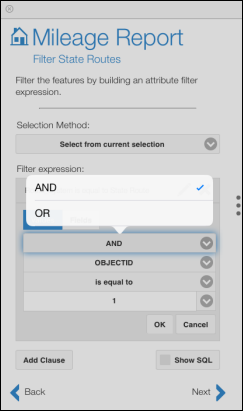
Adding a second attribute selection clause 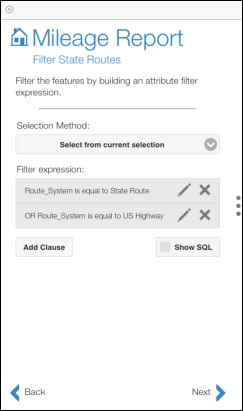
The second attribute selection clause is added - The spatial and attribute filters work in conjunction with each other; that is, you can apply an attribute filter in addition to the spatial filter and vice versa.
- You can use the Show SQL button to write an SQL statement instead of using the UI to create an attribute filter.
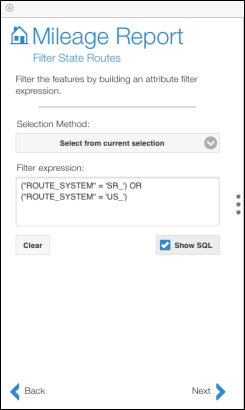
Using SQL to create an attribute filter - Klicken Sie auf OK.
- Click Next after applying the attribute filter.
Hinweis:
Selecting the summary field or fields
The next stage in producing the mileage report is to select a summary field. This is an optional choice. If you don't want to add summary fields to your report, skip this step by clicking Next.
- Click the Summary Layer drop-down arrow and choose a summary layer.
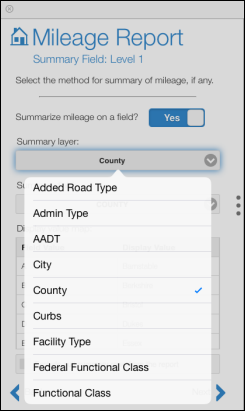
Choosing the summary layer - The internal events that are part of the LRS published in the map service the Roadway Reporting is using appears in this drop-down list.
- Click the Summary field drop-down arrow and choose the summary field.
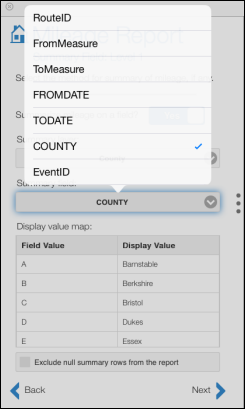
Choosing the summary field The summary field is part of the summary layer that you selected in the previous step. The mileage is summarized on the basis of unique values present in the summary field. The Display value map shows the unique values present in the summary field. You can edit the display value field in the table. You can also exclude null summary rows by checking the Exclude null summary rows from the report check box. By doing so, any gaps that exist in the linear event data will not be summarized and reported on.
- Click Next after choosing the summary layer and summary field.
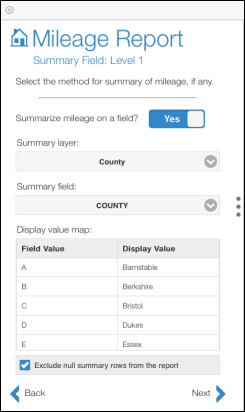
Adding the mileage fields
After selecting the summary layer, the next step is to add the mileage fields. These mileage fields form the columns that show the mileages in the report. The mileage is calculated by using internal event layers or by using the network layer. An event layer that does not belong to the same network as chosen in the previous step, but is part of the LRS, can be used as a mileage layer. At least one event field is required to calculate mileages for the Mileage report.
- Click Add Field(s).
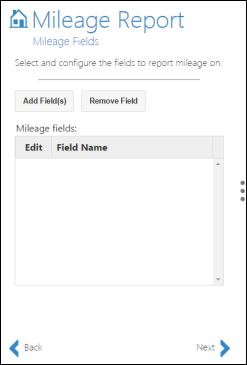
Adding a mileage field - Click the Mileage Layer drop-down arrow and choose a layer for which to report mileage.
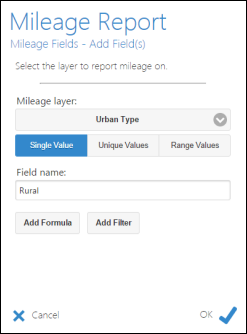
Selecting the mileage layer The mileage is calculated using this layer.
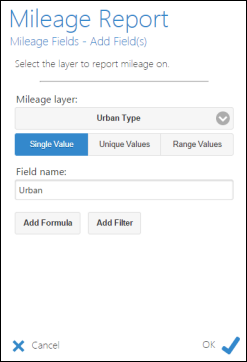
- Choose the Single Value option.
Use this option when you want to calculate the mileages for a single class within the attribute field. For example, within the Speed Limit field, calculating mileages where the speed limit is more than 40 miles per hour.
- Type the column header name in the Field name text box.
This will be the header for the mileage column in the report.
- Choose to add a filter.
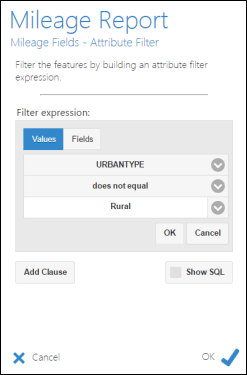
- You can add an attribute filter to the mileage field. For example, if you want to report mileage for only Urban Type=Rural roads, this is where the filter would be applied.
- A formula can also be used to calculate the mileage fields. For example, a formula for VMT (Vehicle Miles Traveled) can be calculated by multiplying AADT (Annual Average Daily Traffic) with length (the distance value available to each layer being used to report mileage against); therefore, VMT = AADT*LENGTH.
The attribute filter page opens.
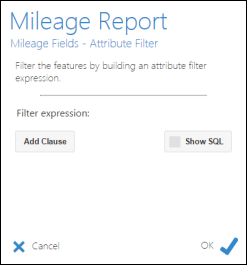
Attribute filter - Add the clause by creating a filter expression.
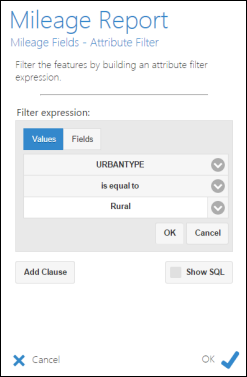
Adding an attribute filter to the mileage field In this example, you'll use the Urban Type internal event. The mileage will be calculated for Rural routes present in the selection set.
- Klicken Sie auf OK.
- Add another mileage field, Urban, to the report using the same Urban Type layer. This time, add the clause that URBANTYPE does not equal to Rural.
The second mileage field is added.
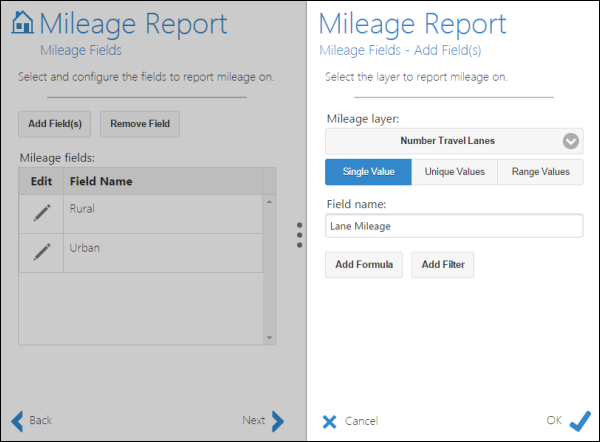
Adding the second mileage field - Add another mileage field using the Number Travel Lanes layer and name it Lane Mileage.
- Choose to add a formula.
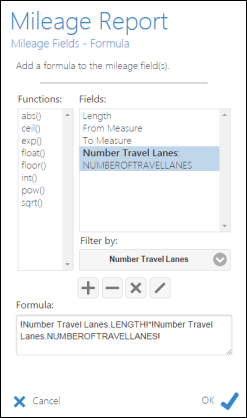
Adding a formula to calculate mileage - Write the formula !Number Travel Lanes.LENGTH!*!Number Travel Lanes.NUMBEROFTRAVELLANES!.
In this formula for calculating lane mileage, the following information is true:
- !Number Travel Lanes.LENGTH! = !to_measure!-!from_measure! for the Number Travel Lanes event layer. The variable !LENGTH! is provided for every mileage layer. !LENGTH! is the distance value available to each layer being used to report mileage against.
- The variable !Number Travel Lanes.NUMBEROFTRAVELLANES! comes from the values present in the attribute field of the selected mileage layer.
- The event names are prefixed to the variables.
- You can use formulas for calculating mileages such as VMT (Vehicle Miles Traveled, which is calculated by multiplying AADT by Length).
- Add another mileage field from the Toll Road layer and name it Toll Roads.
- Add two clauses in the attribute filter so that the mileage can be calculated on roads that have tolls on one side or both sides.
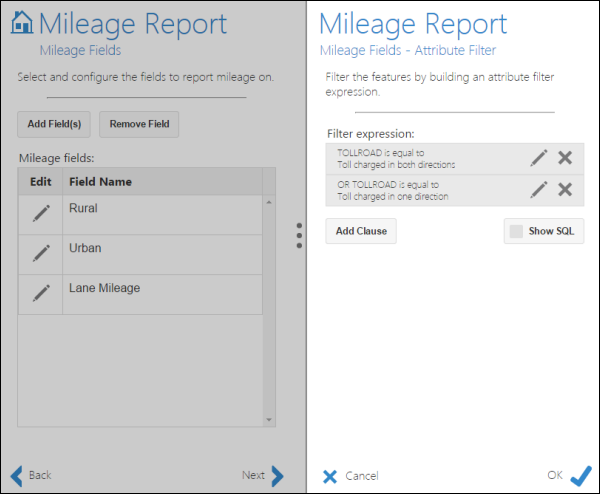
Four mileage fields have been added.
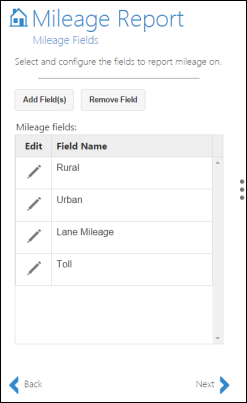
- Click Next.
Calculating mileages for dominant routes only
The Roadway Reporter allows you to calculate mileages only for dominant routes where route concurrences exist.
Concurrent routes are the routes which share the same pavement partially or fully but have different Route IDs of Route names. In the locations where these concurrences exist, you can choose a route that is considered dominant using a set of rules. For more information on setting up route dominance, see Configuring route dominance. Take, for example, the routes in this graphic: 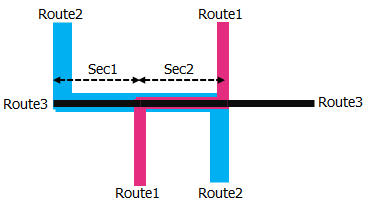
| Route ID | Mileage | Dominant Section | Dominant Section Mileage | Reported Mileage |
|---|---|---|---|---|
Route1 | 3 | Section2 | 1 | 3 |
Route2 | 4 | Section1 | 1 | 3 |
Route3 | 3 | 1 | ||
Total | 10 | 7 |
Hinweis:
- Route dominance rules should be configured to access this functionality.
- In the case where the tool is unable to determine the dominant route either due to a tie or missing data, then one of the concurrent routes is chosen at random to calculate the mileage.
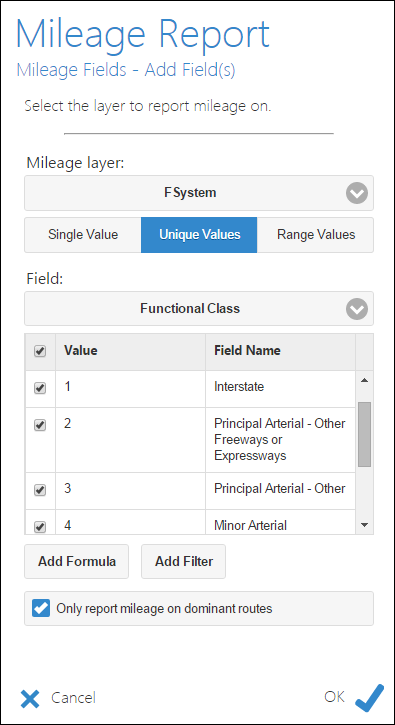
You can calculate mileages only for dominant routes by checking the Only calculate mileage on dominant routes option.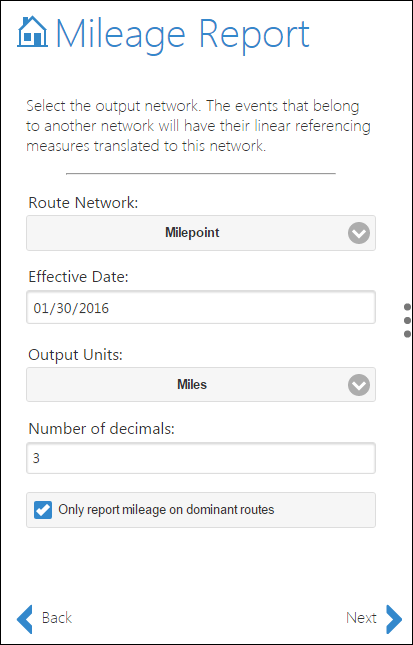
Hinweis:
Running a report on a route with a measure gap may produce the incorrect mileage if the mileage report was run on only a network with no events.
A workaround is to add an event layer to your report as a mileage field and uncheck the box next to this event field in the report fields screen so that the field does not display in the report.