The Draw widget allows you to create graphics that display on the map. It can optionally add line distance or polygon area to the feature as text.
The Draw widget enables end users to draw simple graphics and text on the map. It provides basic sketching and redlining functionality for the web app. It also displays some measurements (if configured to do so) for drawn features, such as length for lines, and area and perimeter for polygons. When the widget initially opens, a dialog box appears that contains 11 feature creation tools. From left to right, they are as follows:
- Point
- Line
- Polyline
- Freehand Line
- Triangle
- Rectangle
- Circle
- Ellipse
- Polygon
- Freehand Polygon
- Text

Configure the Draw widget
This widget can be set to open automatically when
an app starts. To enable this feature, click the Open this widget automatically when
the app starts button  on the widget, which turns it dark
green.
To configure the Draw widget, complete the following steps:
- Hover over the widget and click the Configure this widget button
 to open the configuration properties dialog box.
 - Set the distance or area units.
- Select the unit for the distance or area. The abbreviation and conversion factor are not editable.
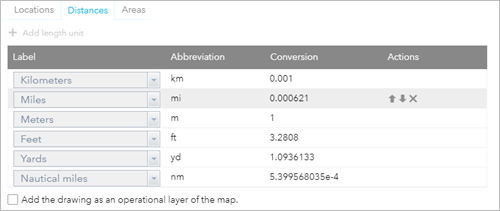
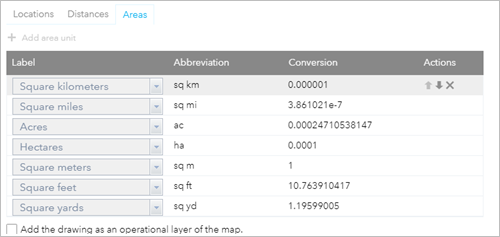
- Optionally change the order of the units. Click the up or down arrow
 of the unit in the Actions column to modify the order.
 - To delete a unit of measure, click the close button
 of the unit in the Actions column.
 - To add a unit of measure, select Add Length Unit or Add Area Unit on the Distances or Areas tab, respectively.
- Select the unit for the distance or area. The abbreviation and conversion factor are not editable.
- Check Add the drawing as an operational layer of the map if needed.
- Click OK to close the dialog box.
By default, all supported units appear on the Distances and Areas tabs.
Use the Draw widget
To get started with the Draw widget, complete the following steps:
- Click the symbol type to select the drawing mode.
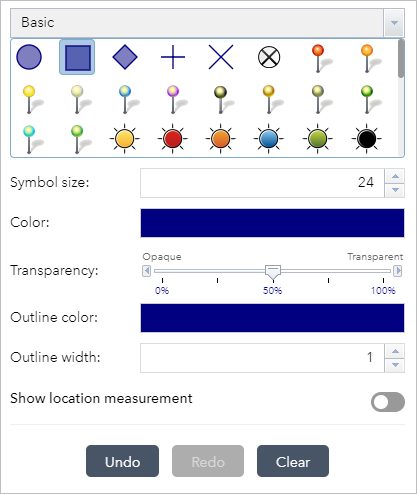
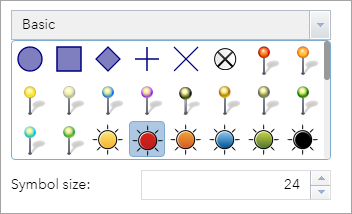
- Optionally change the symbol for the feature using the symbol picker.
- For point symbols, select the marker category (different symbols are available in each category) to set the size, color, transparency, outline color, and outline width of the symbol. Only the size category is available for picture marker symbols.
- For line symbols, select a predefined symbol from the box. You can also customize the color, style, transparency, and width of the symbol. Click the Show Measurements check box and select the Distance Units to display the measurement with the line.
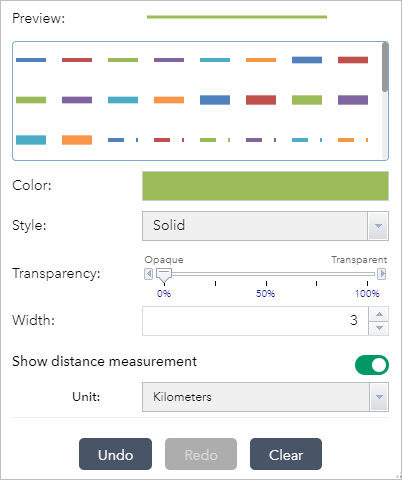
- For polygon symbols, select a predefined symbol from the box. You can also customize the fill color, transparency, outline color, and outline width of the symbol. Click the Show Measurements check box and select the Area Units to display the measurement with the polygon.
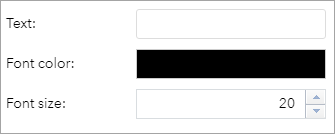
- For text, type the text to be drawn in the Text box, and select a font color and size for the text.
- For point symbols, select the marker category (different symbols are available in each category) to set the size, color, transparency, outline color, and outline width of the symbol. Only the size category is available for picture marker symbols.
- Draw the desired features and text on the map.
- If the Add the drawing as an operational layer of the map option is checked, open the Layer List widget.
The Draw Results layer appears.
- Click Undo or Redo to undo or redo the drawing features, or click Clear to remove all of them.