The Situation Awareness widget allows you to specify a location on the map and analyze information from different feature layers within the specified area.
Configure the Situation Awareness widget
This widget can be set to open automatically when
an app starts. To enable this feature, click the Open this widget automatically when
the app starts button  on the widget, which turns it dark
green.
- Hover over the widget and click the Configure this widget button
 to open the configuration properties dialog box.
 - Optionally click the Change widget icon button and replace it with your own image. A file explorer window opens, allowing you to choose a local image file to use as the widget icon.
- Under the Analysis tab, click Add Tab. Each tab allows you to specify a feature layer in the map and the type of analysis using one of the following options:
- Summary—A summary of numeric fields from the selected layer.
- Proximity—A list of features from the layer that are within the specified area.
- Closest Feature—The closest feature to the location.
- Grouped Counts—A count of features within the specified area, grouped by a specified field.
Note:
If the Grouped Counts option is selected, Group By Field is required. Click the Edit button under Actions to define Group By Field.
Optionally, a label can be specified for each tab.
To specify fields to be included in the analysis, click the Edit tool under Actions to open the Select Fields window.
Optionally, check Display feature count to see a count added to each tab in the panel.

Optionally, change the order of tabs or delete a tab under Actions.
In the General Settings section of the configuration window, you can specify the following options:
- Tab label—Specify a label for the tab in the widget.
- Area of interest label—Specify a label for the area under the tab.
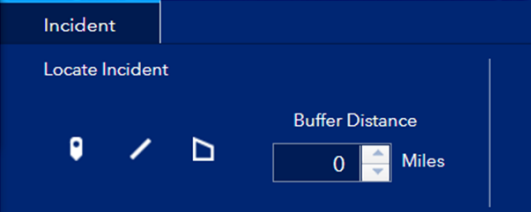
- Buffer label—Optional label for the buffer distance.
- Minimum buffer distance—Minimum distance allowed to buffer.
- Default buffer distance—Buffer distance set by default .
- Maximum buffer distance—Maximum distance allowed to buffer.
- Closest feature maximum distance—The maximum distance to use when searching for the closest feature.
- Enable routing—Check this option to enable routing from the location to the feature. The Directions widget is also required to generate routes.
- Disable layer visibility management—Check this option to avoid automated control of layer visibility for the layers used by the widget. When this option is enabled, the layer visibility will not be altered when the widget is turned on.
- Display summary features—Check this option to display the map features for a tab that uses a summary analysis.
- Distance units—Select the units to be used for proximity and closest feature analyses, as well as when providing a buffer distance for analysis.
- Under the Output tab, choose the data output settings and report settings.
- Under Data Output Settings, check the Enable Save option to allow users to add or delete features from the feature service. Check Save points, Save lines, or Save polygons, and specify the layer for each selected type.
Note:
The feature service has to be editable in order for this option to be enabled.
- The Enable snapshot option enables the ability to create a snapshot of the situation at a specific moment in time. This behavior requires specific permissions:
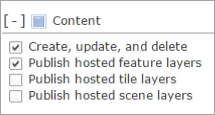
- The Export all fields option, which includes all fields in the layer when exporting to a CSV file, is checked on by default. If you want to only include the fields configured in the Select Fields window for summary, grouped counts, or proximity analyses, uncheck this option.
- Under Report Settings, check the Enable report option to create a report of the map and summarized information from the configured tabs. Optionally, click the image icon to specify a logo image for the report. You can also provide text to be displayed in the footnote of the report, or choose a color for the column headers. The printed report will contain a map and a series of tables displaying the analysis results. Fields that are visible in the layer’s pop-up are the fields reflected in the detailed information table for each tab.
Note:
The weather option is no longer available in the Situation Awareness widget.
- Under Data Output Settings, check the Enable Save option to allow users to add or delete features from the feature service. Check Save points, Save lines, or Save polygons, and specify the layer for each selected type.
Use the Situation Awareness widget
- Click the Situation Awareness widget button to open it. The widget displays at the bottom of the map.
When the widget opens, visibility is turned off for all map layers that have been configured as source layers for the widget unless Disable layer visibility management was enabled. The layers are made visible when used by the widget. When the widget is turned off, layer visibility is returned to its original state.
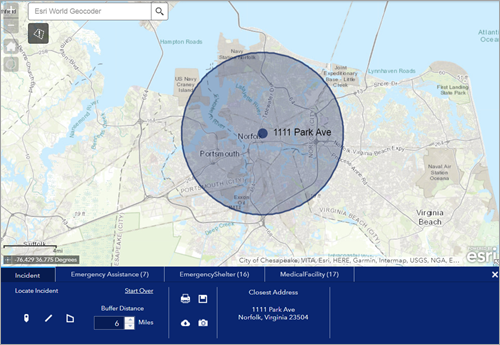
The Incident tab is selected by default.
- Define a location in one of the following ways:
- Click an existing feature to show its popup then click the ellipsis button to see the list of feature actions and choose Set Location.
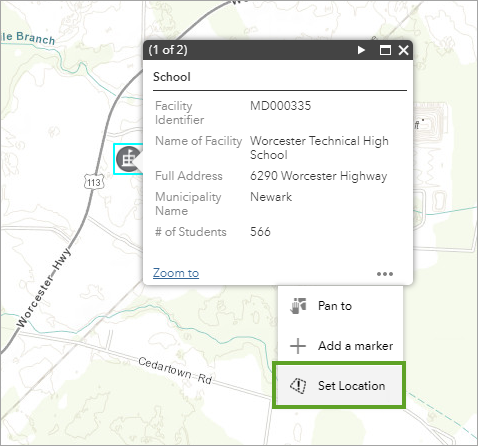
- Use the drawing tools on the widget's Incident tab to create a new location to analyze.
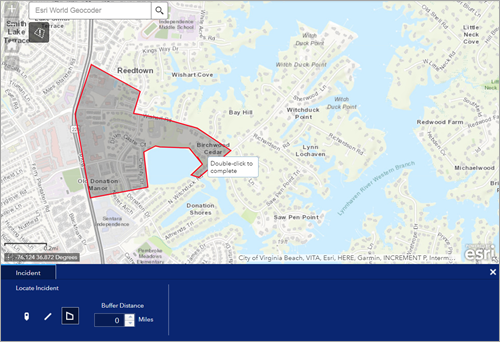
Optionally specify a buffer distance to the location.
- To download summarized information, click the Download all button
 .
. - To save the location to the feature service, click Save
 .
. - To create a snapshot of the location and analyzed information, click the Create snapshot button
 .
. - To create a report of the location and analyzed information, click the Create report button
 .
.
- To download summarized information, click the Download all button
- To see map features in the generated report, use the Disable layer visibility management configuration setting and enable or disable appropriate layer visibility using other widgets such as the Layer List widget before generating the report.
- Click an existing feature to show its popup then click the ellipsis button to see the list of feature actions and choose Set Location.
- Click the individual Layer tabs to view the analyzed information for specified layers. You can scroll the widget panel horizontally to view additional results.
Optionally click Download
 to download analyzed data as a CSV file.
 Optionally, if routing is enabled and the Directions widget has been added to the app's header controller, click the directions icon to get directions from the incident to the feature. For line and polygon incidents, enter an appropriate starting point directly in the Directions widget.
To clear the active location, click the Start Over option.
Click the close button in the upper right corner of the widget.