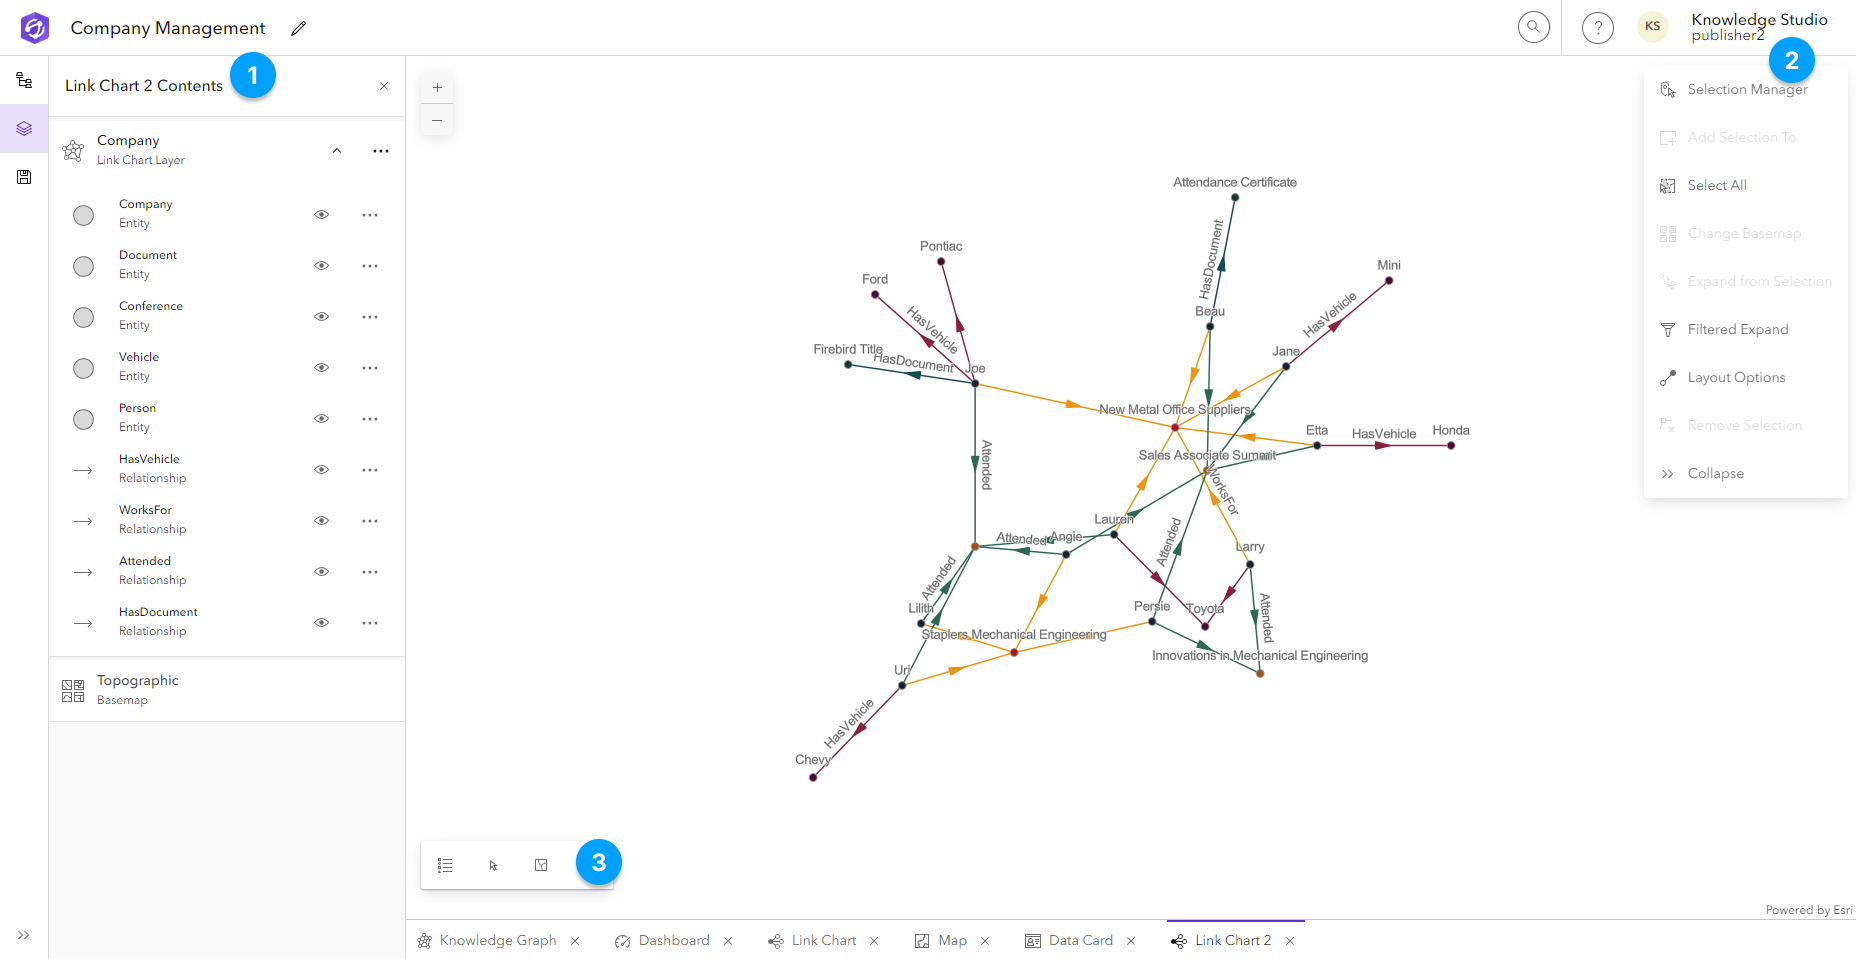
A link chart visually represents all or part of a knowledge graph. The sections below introduce main link chart terminology and common link chart operations.
Link charts
A link chart is composed of point features that represent entities and line features that represent relationships in a knowledge graph. These link charts are created and opened in a link chart view and appear as link charts in the Project Contents pane.
In the Link Chart Contents pane, the knowledge graph is represented as a link chart layer.
The link chart layer (number 1 in the image below) is composed of one sublayer for each entity type and each relationship type in the knowledge graph. This sublayer represents entities or relationships of that type in the knowledge graph. The default name for each sublayer corresponds to the name of the entity type or relationship type it represents. Explore link charts using the common link chart operations and analysis tools on the context toolbar (number 2 in the image below).

Common link chart operations
You can create a link chart from any set of knowledge graph entities and relationships.
Once you have a link chart, you can modify its content.
- Expand link chart content
- Add missing entities and relationships to the link chart
- Change the layout of the link chart
- Add entities and relationships to a link chart
- Remove entities and relationships from a link chart
Explore and analyze the contents of a link chart to gain a better understanding of the knowledge graph.