The Query widget allows you to retrieve information from source data by executing a predefined query. Data sources can be one of the following:
- Feature layer in the current map
- Feature layer as an item in the portal
- Feature layer from an ArcGIS Server REST service
Tip:
A feature layer can be from a map service or a feature service.
- Imagery layer from image service
- Related table
The Query widget serves as a query builder during configuration, allowing you to define the query by specifying source data, filter expression, and displaying fields in query results. Each query works with a single layer. However, you can define multiple queries for a single app and data layers can be from multiple sources.
Configuring the Query widget
The Query widget can be set to open automatically when an app starts. To do so, click the yellow dot on the widget to turn it to green.
The following steps indicate how to create a definition query. Repeat these steps if you need to define multiple queries.
- Hover over the Query widget and click the small edit icon
 .
.The configuration window for this widget opens.
- Optionally, click change widget icon if you want to replace the default icon for this widget.
A file explorer window opens, allowing you to browse to a local image file to use as the widget icon.
- Click Add New next to Query Tasks.
The Set Data Source window opens. By default, Select from Map is chosen and all feature layers in the current map are listed below it.

Alternatively, you can choose Select from Portal or Add Service URL. In addition to layers, you can query against related tables.
- Choose the radio button next to a data source.
- Select a layer from the list.
- Click OK to close the Set Data Source window and return to the query configuration window.
By default, the Filter Definition tab is active.
- Click Add a filter expression to display the expression builder.
- Select a query field, an expression, and provide a value in the text box. Optionally, choose the Unique option to list all unique values for the selected field in the layer. This option is useful when your selected field is a string or number.
- Optionally, check Ask for values.
- You also have the option to use Add an expression set, which allows you to define and apply two filters to a single query. Depending on if All or Any of the expressions in this set are true, either records meeting all the expressions or records meeting any of the expressions in the set return as the results.
- Click the Results Setting tab to activate it. This tab allows you to configure the displayed title and sort contents for the query results. Fields from the data layer available for display show on this tab.
- Click the add button next to the Result Item Title text box.
The list of fields in the layer displays and allows you to select one at a time. Values from the selected field display in the text box and are used as the query results title. Repeat this step to add additional fields. When multiple fields are added, the concatenation of field values are used as the result title.
- Click the pencil button next to the Result Item Sorting to configure the fields by which the query result is sorted.
The services must support pagination o sort on the query result.
- Under Result Item Contents, check the fields you want to display in the results. For individual fields, the Special Type column allows them to display as a link or an image according to your selection. You can also click the up or down arrows in the Actions column to adjust the field order.
- Click the symbol for the query results.
The preview window opens, allowing you to choose the color and style for the result highlighting symbol.
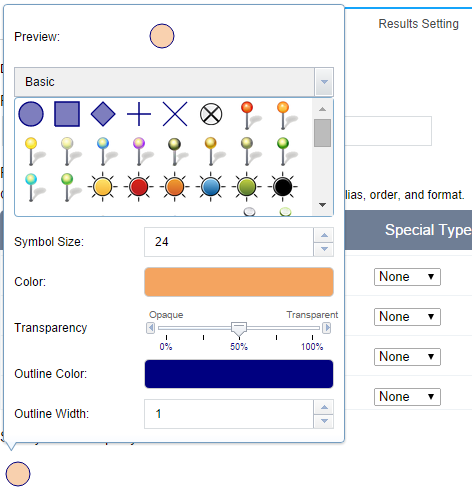
- Click anywhere outside of the symbol preview window to close it.
- Click OK to close the Query window.
The query definition is saved and the query configuration window closes.
- To re-order the existing tasks, hover over the task name and click the Mouse up or Mouse down arrow. To change a task name, click the task under the task name table, update the text in the Task Name text box, and click another place on the window to confirm the change.
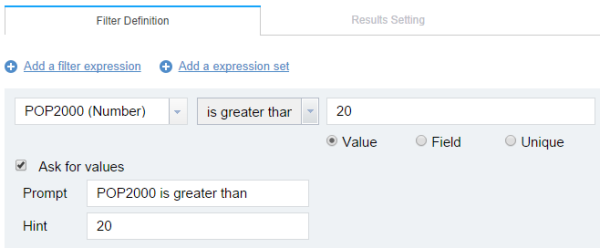
The filter expression can be a value based operation or an operation between two fields. Choosing the Unique option lists the unique values for the selected field in the layer. By default, Value is chosen.
Using the Query widget
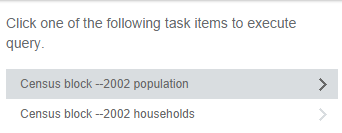
Clicking the Query widget in your app displays the list of predefined queries. Selecting a query displays the options for executing it. Those options are as follows:
- If Ask for values is specified at configuration time, a text box displays prompting you for a new value for the parameter. The default value shows in the box initially. If unique values are set, the text box will list all of them.
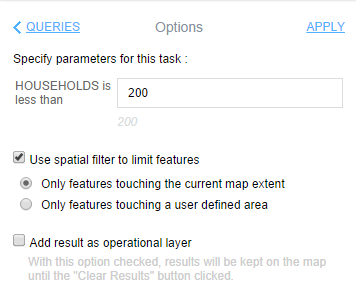
- Use spatial filter—The spatial filter is applied on top of the query definition.
- Use current map extent—Only features falling within the current map extent and meeting the query definition return.
- Draw a graphic on the map—Only features falling within the graphic and meeting the query definition return.
- Add result as operational layer—When this option is checked, query results remain on the map until the Clear Results button is clicked.
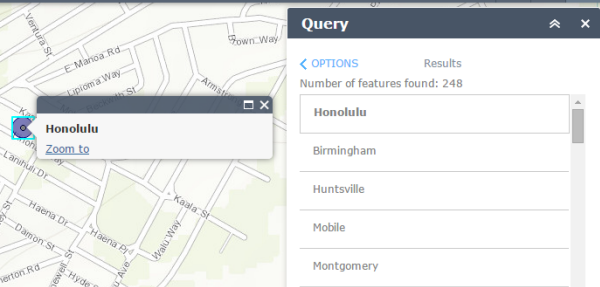
You can choose none or multiple options. Click Apply to execute the query and display the results. If the layer has related data, the related records are also included in the results. Features resulting from the query highlight on the map with the symbol you specified at configuration time.
Tip:
The maximum features a query can return depends on the maxRecordCount property set in the service. By default, it is 1000. For example, if you take the default value and expect 1300 features to return from a query, you will see 1000 features in the query result panel first. When you scroll down the panel, you will see the remaining 300 features.
Alternatively, if the query is performed on a related table, the related features will display in the result.